Candlestick patterns have long been used by traders to identify potential market reversals and trend continuation signals. The Figures Candle MT4 indicator is designed to search for and identify these patterns, making it easier for traders to incorporate candlestick analysis into their trading strategies. This comprehensive tool provides valuable insights into market dynamics and can significantly improve trading performance when used in conjunction with other technical analysis tools.
Main Features of the Figures Candle MT4 Indicator
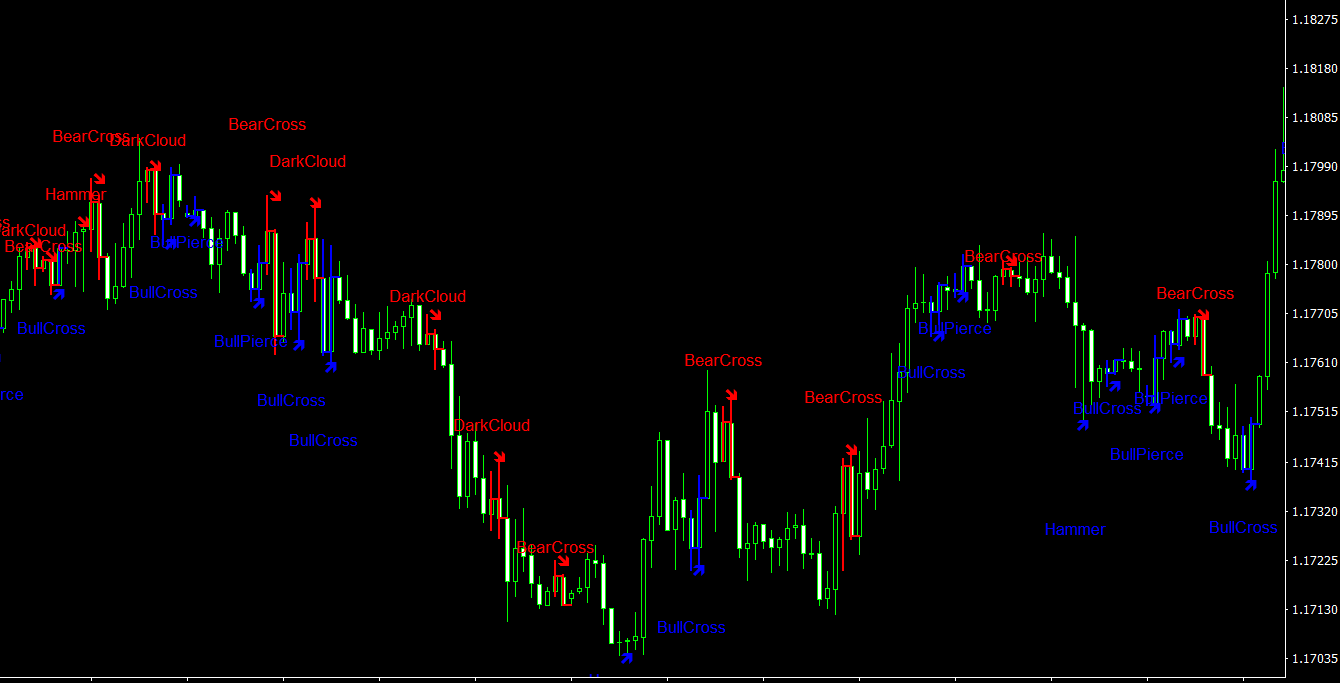
- Identifies Key Candlestick Patterns: The Figures Candle indicator is capable of recognizing the most important price action patterns on the chart, such as Bear Cross, Dark Cloud, Hammer, Bull Cross, Bull Pierce, Morning Star, and Evening Star. These patterns can provide essential clues about the market’s direction and potential turning points.
- Visual and Textual Representation: The indicator not only identifies the candlestick patterns but also visually displays them on the chart with the corresponding buy or sell arrows. Each pattern is labeled with its name and color-coded for easy identification, making it simpler for traders to interpret the information and make informed decisions.
- Applicable to Various Timeframes: While the Figures Candle indicator can be used on multiple timeframes, it is recommended to apply it on timeframes of H4 and higher. This is because the accuracy of candlestick patterns tends to decrease on lower timeframes due to increased market noise and volatility.
How to Use the Figures Candle MT4 Indicator in Trading
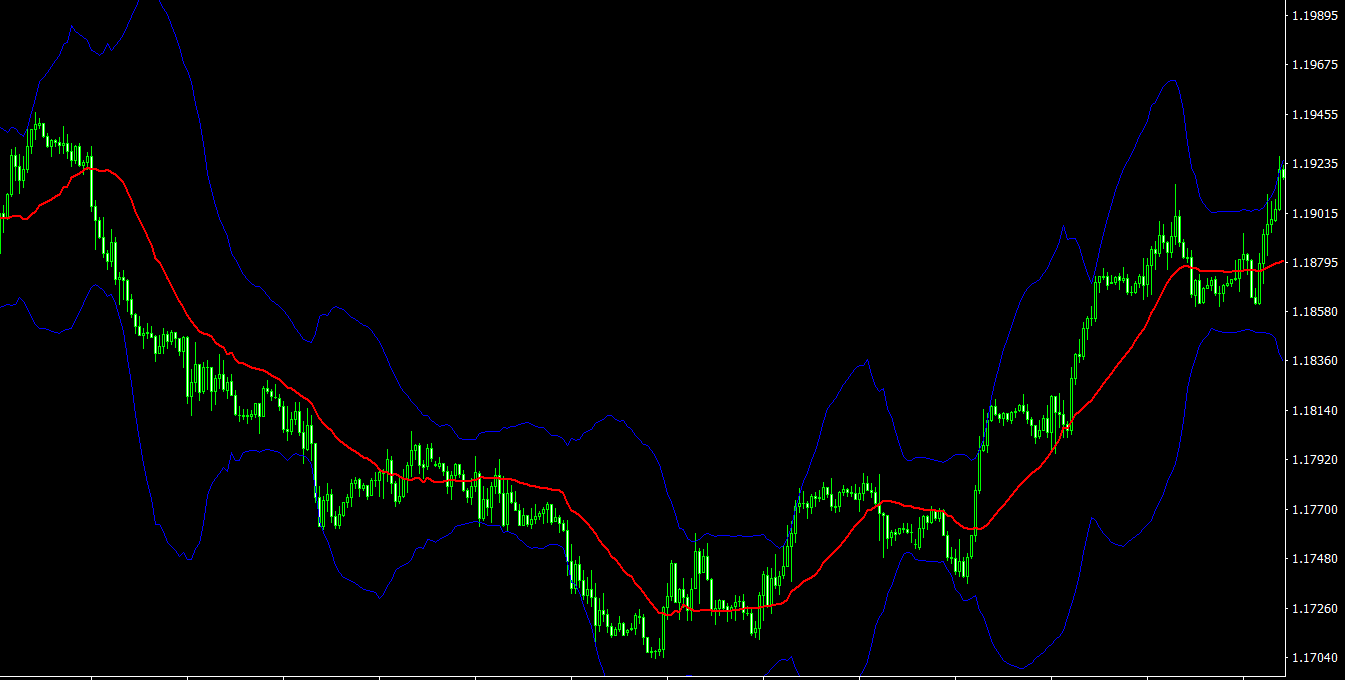
- Combine with Other MT4 Indicators: The Figures Candle indicator is most effective when used alongside other technical analysis tools, such as trend lines, support and resistance levels, and moving averages. This multi-faceted approach can help traders confirm the validity of the signals generated by the indicator and enhance their overall trading strategy.
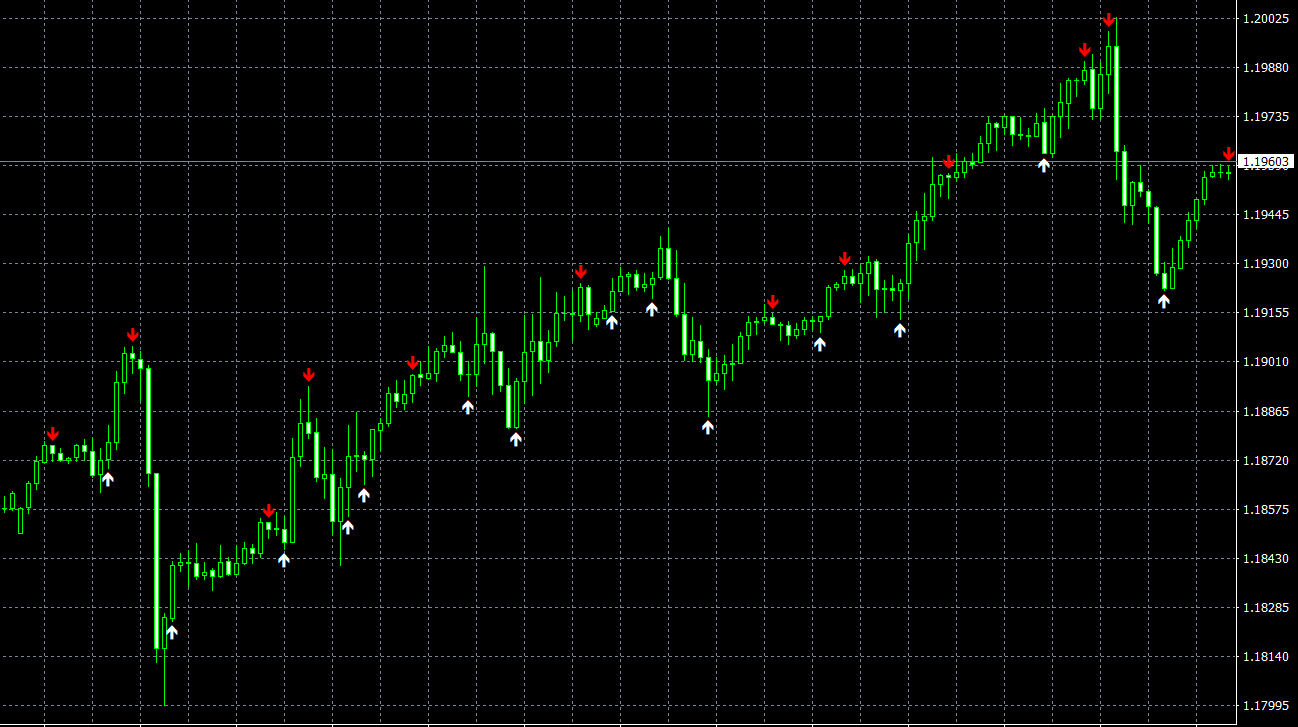
- Establish Entry and Exit Points: The buy and sell signals generated by the Figures Candle indicator can be used to establish entry and exit points for trades. For instance, a Bull Cross pattern accompanied by a buy arrow could be considered a potential long entry signal, while a Bear Cross pattern with a sell arrow might indicate a short entry opportunity. It’s essential to use proper risk management techniques, such as stop-loss and take-profit orders, to protect your trades and maximize profits.
- Monitor Market Sentiment: The Figures Candle indicator can also provide valuable insights into market sentiment, as the appearance of specific candlestick patterns may indicate a shift in the balance of power between buyers and sellers. By understanding the underlying market psychology, traders can better anticipate future price movements and make more informed trading decisions.
Conclusion
The Figures Candle MT4 indicator is a powerful tool for traders looking to incorporate candlestick pattern analysis into their trading strategies. By identifying key patterns and providing clear visual and textual representations of these patterns, the indicator simplifies the process of interpreting market data and enhances trading performance. When used in conjunction with other technical analysis tools and sound risk management practices, the Figures Candle indicator can be an invaluable asset in the pursuit of trading success.
Features of Figures Candle MT4 indicator
- Platform: Metatrader 4
- Ability to change settings: No
- Timeframe: any from 1 Minute to Daily, H4 and higher recommended
- Currency pairs: any
In FiguresCandle.zip file you will find:
- FiguresCandle.ex4
Download Figures Candle MT4 indicator for free:


