In the vast realm of Forex trading, tools that simplify the decision-making process hold immense value. Among these tools, the RSI Heatmap MT4 Indicator stands out as a unique fusion of traditional technical analysis and visual representation. This article sheds light on the functionality and applicability of this innovative indicator in the dynamic world of currency trading.
Introduction to the RSI Heatmap MT4 Indicator
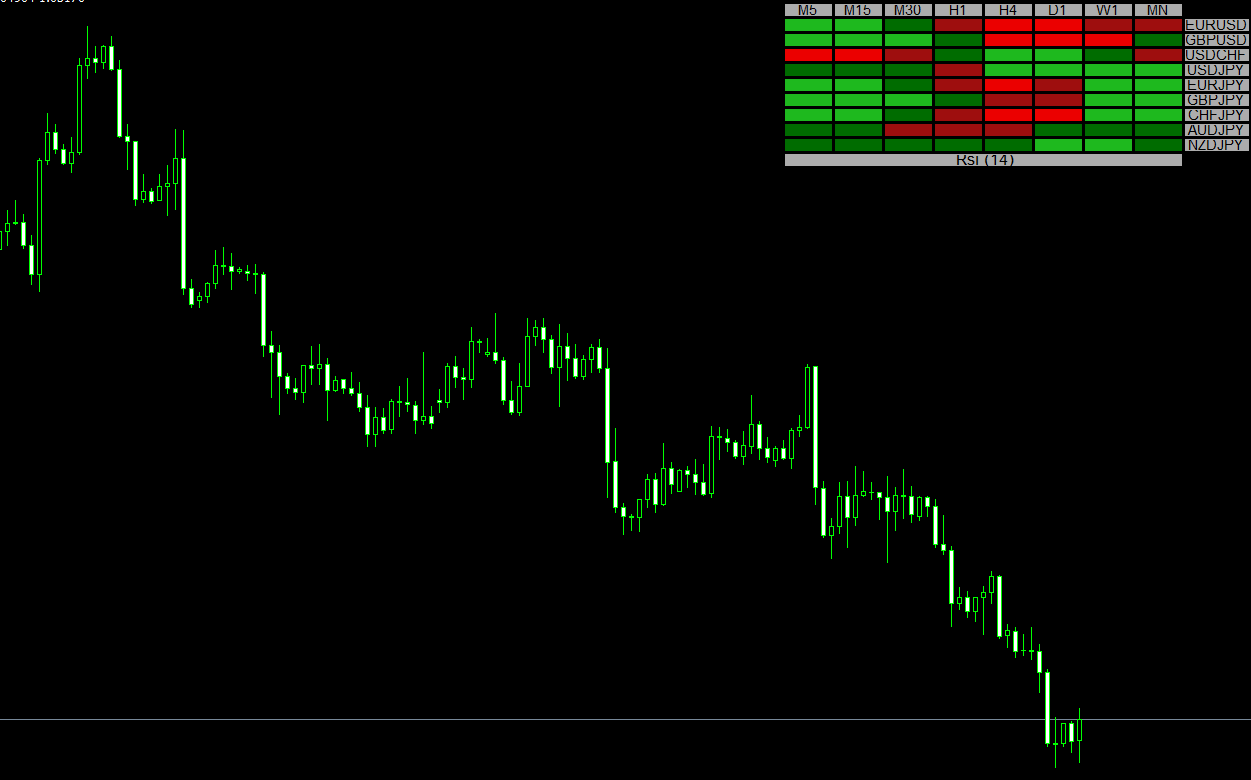
At the heart of the RSI Heatmap MT4 Indicator lies the widely recognized Relative Strength Index (RSI) – a momentum oscillator measuring the magnitude of recent price changes to evaluate overbought or oversold conditions. By integrating the RSI with a heatmap visual, the indicator allows traders to grasp the strength of multiple currency pairs across various timeframes instantly.
The Essence of the Currency Strength Heatmap
The core functionality of this tool is to offer a visual representation of currency strength based on RSI values. The heatmap employs a straightforward color-coding system:
- Dark Green: An indicator that the RSI is above 50. This is a weak upward signal, suggesting a potential bullish move but not necessarily a strong one.
- Light Green: Implies that the RSI is above 60. This is a strong upward signal, pointing to a more potent bullish momentum.
- Dark Red: Indicates an RSI below 50, which is a weak downward signal. While it may suggest bearish momentum, it’s not a definitive downtrend signal.
- Light Red: Signals that the RSI is below 40, which translates to a strong downward signal. This is a more solid indication of bearish momentum.
Tailoring the RSI Heatmap to Your Needs
One of the distinctive features of the RSI Heatmap MT4 Indicator is its adaptability. Traders have the flexibility to adjust the currency list, position and style of the table, and RSI settings, including the period and price. Moreover, the critical levels for signal interpretation can be modified, offering a customized experience tailored to a trader’s strategy and risk appetite.
Trading Based on RSI Readings from Multiple Timeframes
When leveraging the RSI heatmap, it’s essential to understand the power of analyzing multiple timeframes. A multi-timeframe approach provides a holistic picture, ensuring traders don’t get blindsided by focusing too narrowly.
- Confirming Trends: By viewing the RSI heatmap across various timeframes, traders can confirm the strength and validity of a trend. For instance, if a currency pair shows light green (strong bullish) on both daily and hourly timeframes, it indicates a more robust and potentially lasting upward move.
- Spotting Divergences: Sometimes, shorter timeframes might display contrasting signals compared to longer ones. Such discrepancies can serve as early warning signs of potential trend reversals or pullbacks.
- Optimizing Entry and Exit Points: When a currency strength turns from dark green to light green across shorter timeframes, it can be an opportune moment for entry, leveraging the initial stages of a potential strong upward move. Similarly, seeing a transition from light red to dark red can indicate a weakening downtrend, hinting at a possible exit point or trend reversal.
Conclusion
The RSI Heatmap MT4 Indicator is a remarkable tool, merging the reliability of the RSI with the intuitive nature of heatmaps. By offering an immediate visual snapshot of currency strength across multiple timeframes, it equips traders with actionable insights, guiding both novice and seasoned traders toward more informed decisions. As with any tool, it’s vital to employ additional analysis methods and risk management strategies to maximize trading potential while mitigating risks.
Features of RSI Heatmap MT4 indicator
- Platform: Metatrader 4
- Ability to change settings: Yes
- Timeframe: any from 1 Minute to Daily
- Currency pairs: any
In RSI-heatmap-indicator.zip file you will find:
- RSI-heatmap-indicator.ex4
Download RSI Heatmap MT4 indicator for free:


