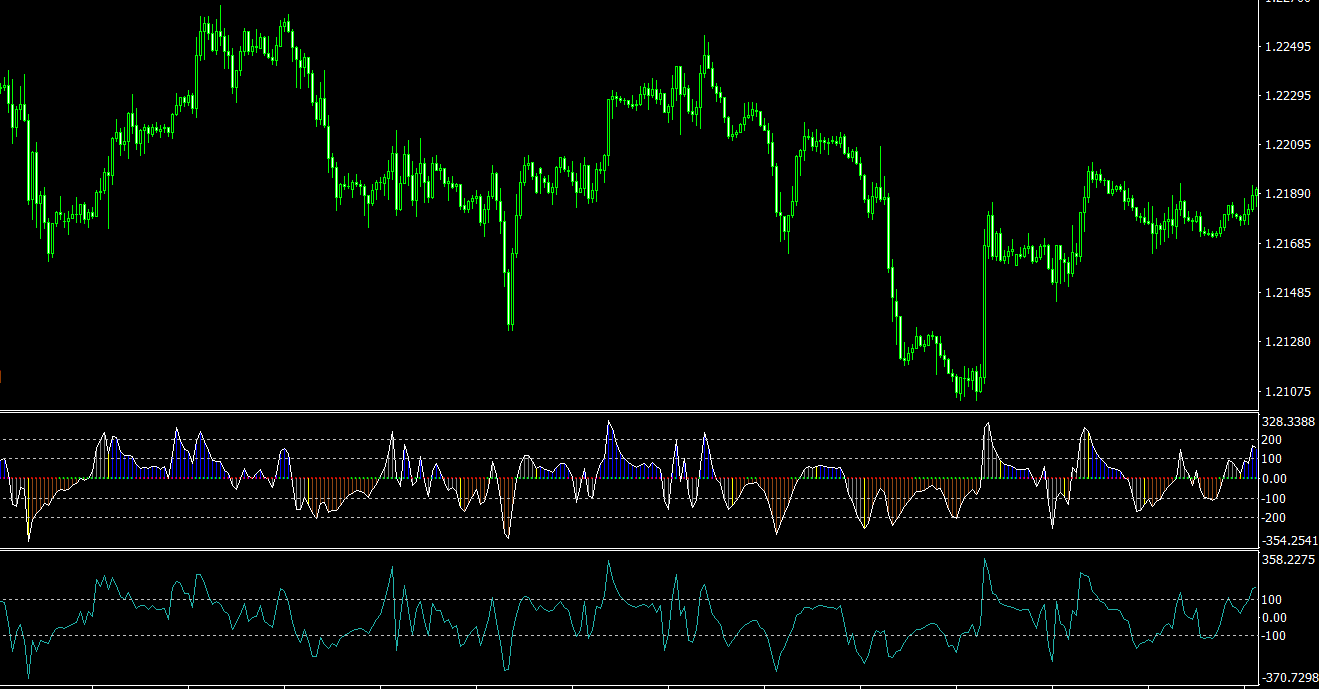
The Relative Strength Index (RSI) is a widely used technical analysis tool in the world of Forex trading. Its primary function is to help traders identify overbought and oversold conditions, which often precede price reversals. The RSI Slowdown MT4 Indicator is a modification of the classic RSI oscillator, designed specifically to identify price reversal points by detecting the slowdown in the rate of change of the RSI. In this article, we will explore the key features of the RSI Slowdown indicator, and provide guidance on how to effectively use it in your Forex trading strategies.
Overview of the RSI Slowdown MT4 Indicator
The RSI Slowdown indicator is based on the premise that before a price reversal occurs, the rate of change of the RSI indicator first slows down and then reverses. To identify these slowdowns, the indicator searches for areas where the price begins to stagnate in the overbought or oversold zones of the fast RSI indicator. By pinpointing these zones, the RSI Slowdown indicator provides traders with valuable insights into potential price reversals, allowing them to capitalize on market opportunities more effectively.
Key Features of the RSI Slowdown MT4 Indicator
- Identifies Price Reversal Points: The RSI Slowdown indicator is specifically designed to identify price reversal points by detecting the slowdown in the rate of change of the RSI. This unique feature enables traders to anticipate market reversals and make more informed trading decisions.
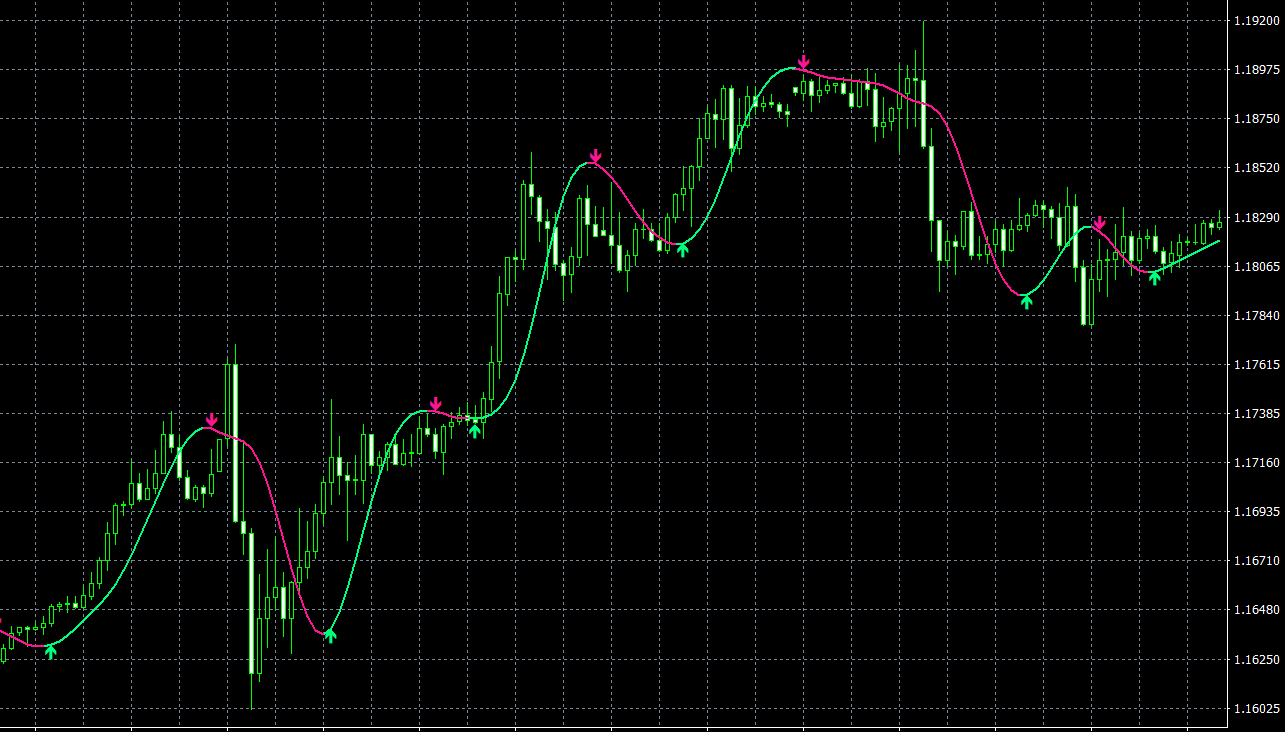
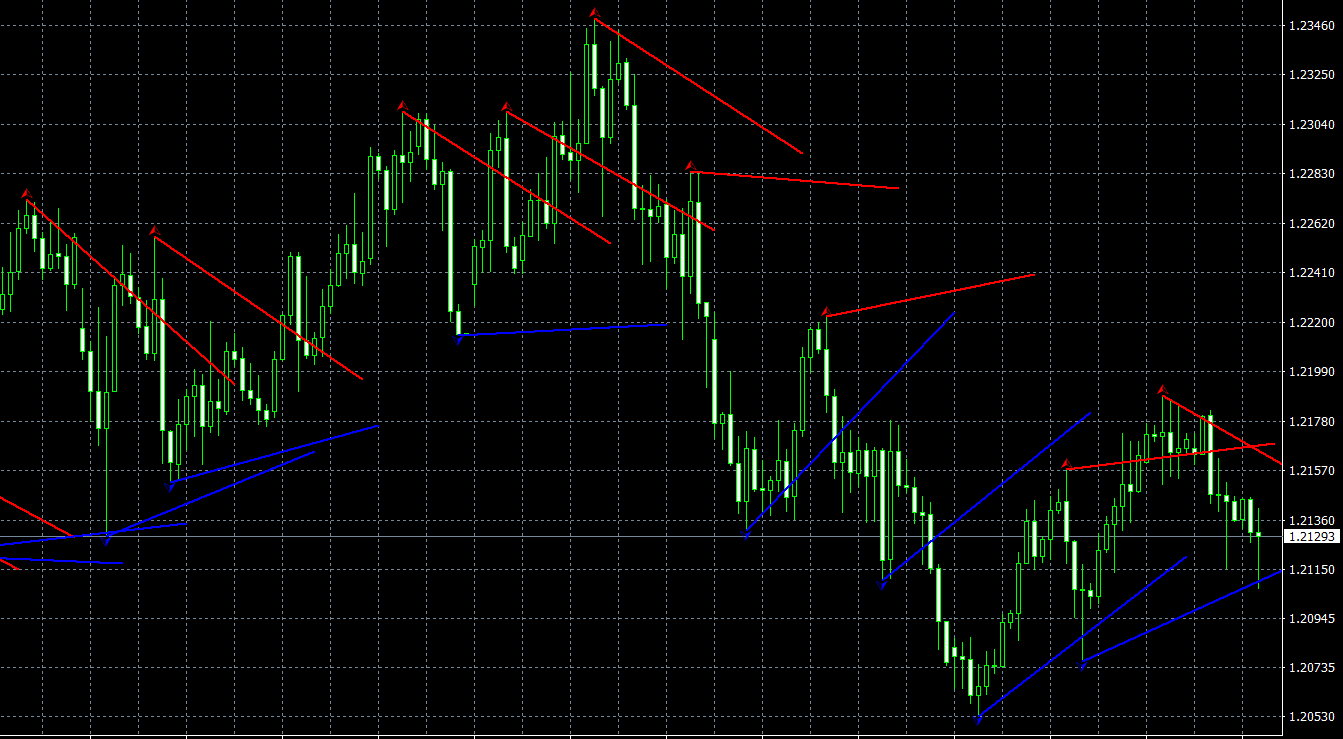
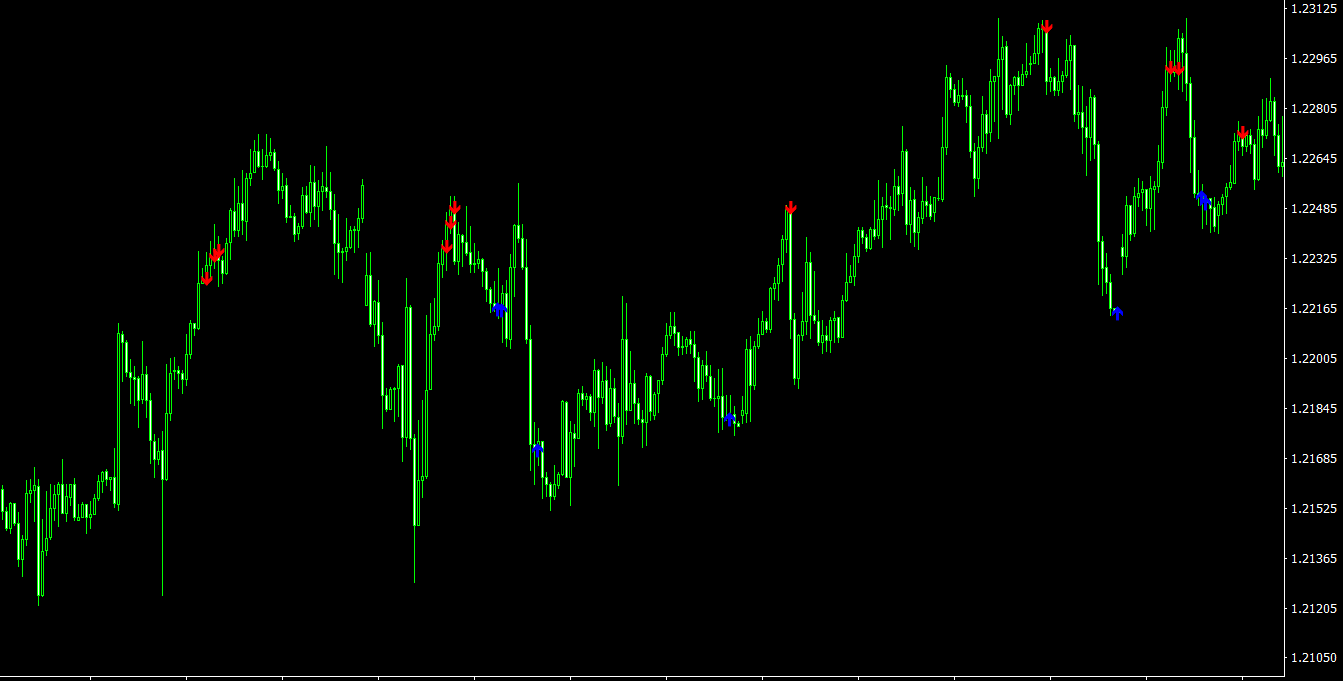
- Customizable Display Options: The RSI Slowdown indicator offers the ability to mark slowdown zones with either arrows or stripes on the price chart. This customizable display feature allows traders to choose the most visually appealing and informative presentation of the indicator’s signals, according to their personal preferences.
- Adjustable Settings: The indicator’s settings can be easily adjusted to enable or disable the search for RSI decelerations. If disabled, the indicator will simply display the excess of the RSI levels set in the settings – LevelMax and LevelMin. This flexibility allows traders to fine-tune the RSI Slowdown indicator to suit their specific trading strategies and risk tolerance.
How to Use the RSI Slowdown Indicator in Trading
To effectively use the RSI Slowdown indicator in your Forex trading strategies, follow these steps:
- Apply the RSI Slowdown indicator to your preferred price chart within the MT4 platform.
- Customize the display options and settings of the indicator, as desired, to optimize its performance and align it with your trading strategy.
- Monitor the price chart for the appearance of arrows or stripes, which indicate the presence of RSI slowdown zones.
- When a slowdown zone is identified in an overbought or oversold area, consider this as a potential signal for an impending price reversal.
- Before executing trades based on the RSI Slowdown indicator signals, be sure to confirm the validity of the signals using other MT4 indicators and market factors. This will help you manage risk and increase the probability of successful trades.
- Execute your trades based on the signals provided by the RSI Slowdown indicator, and manage your positions according to your risk management strategy and profit targets.
Conclusion
The RSI Slowdown MT4 Indicator is an advanced technical analysis tool that builds upon the classic RSI oscillator to provide traders with more precise insights into potential price reversal points. By detecting RSI slowdowns in overbought and oversold zones, the indicator enables traders to anticipate market reversals more effectively and capitalize on trading opportunities.
RSI Slowdown indicator settings
- RSI Period – RSI period
- Signal Level Max – overbought level, where to look for slowdowns
- Signal Level Min – oversold level, where to look for slowdowns
- Seek Slowdown – enable / disable search for slowdowns
- Bar – on which bar we are looking for a signal, 1 means on an already built one, 0 means on the current one
- Type graph – type of signal drawing – arrows or lines
- Alerts – enable sound notification when a signal is found
- Buy Color – color of arrows / buy lines
- Sell Color – color of arrows / sell lines
Features of RSI Slowdown MT4 indicator
- Platform: Metatrader 4
- Ability to change settings: Yes
- Timeframe: any from 1 Minute to Daily
- Currency pairs: any
In rsi_slowdown.zip file you will find:
- rsi_slowdown.ex4
Download RSI Slowdown MT4 indicator for free: