The LRMA BB trading indicator is an innovative modification of the Moving Average, calculated using the linear regression method and supplemented with Bollinger bands. This unique combination of techniques allows traders to benefit from the enhanced adaptability to price changes provided by the linear regression method and the ability to identify potential entry and exit points with the help of Bollinger bands. In this article, we will discuss the LRMA BB indicator in detail and explore its applications in the Forex market.
Understanding LRMA BB Indicator
The Linear Regression Moving Average (LRMA) is a type of moving average that uses linear regression techniques to calculate the average value of data points. Unlike simple moving averages, which assign equal weight to all data points, the LRMA takes into account the relationship between each data point and its position within the dataset, resulting in a more accurate and responsive moving average.
By integrating Bollinger bands into the LRMA, traders can gain additional insight into market conditions. Bollinger bands are a set of lines plotted at a specified number of standard deviations above and below the moving average. These lines act as dynamic support and resistance levels and help traders to identify potential price reversals, breakouts, and trend continuations.
Using LRMA BB Indicator in Trading
The LRMA BB indicator can be effectively used in various trading situations. Here are some ways traders can utilize this powerful tool:
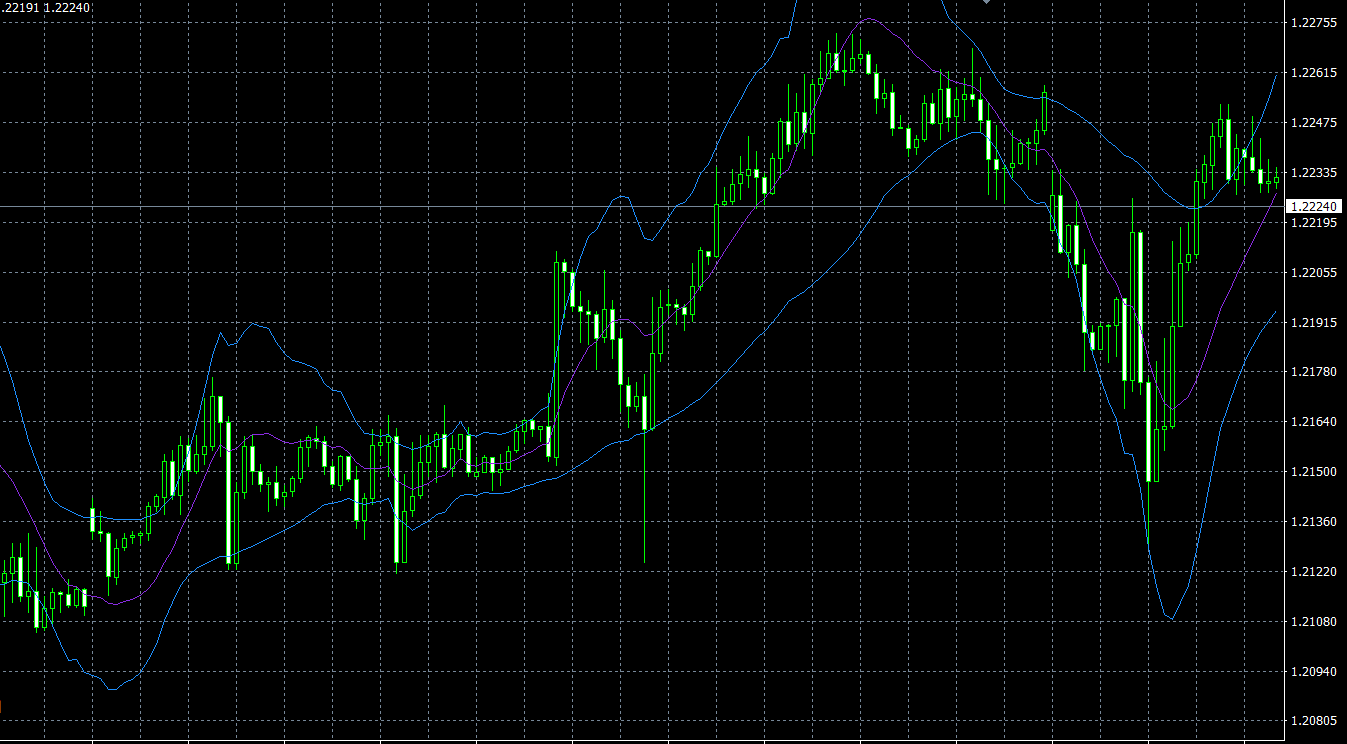
- Trending Market: When the gap between the LRMA BB upper and lower lines expands, it suggests that the market is in a strong trend. Traders can use this information to enter positions in the direction of the trend, capturing potential profits from sustained price movements.
- Flat Market: If the external lines of the LRMA BB come close together, it indicates that the market is consolidating or moving sideways. In such scenarios, traders can look for potential breakouts as the price is likely to make a strong move in either direction soon.
- Price Rebounds: The LRMA BB indicator can also be used to trade price rebounds from the channel boundaries. When the price touches the upper or lower Bollinger band, it may indicate an overbought or oversold condition, respectively. Traders can enter positions in the opposite direction, anticipating a price reversal.
- Stop Loss and Take Profit: The LRMA BB indicator can also be used to set stop loss and take profit levels. Traders can place their stop loss below the lower band or above the upper band, depending on their trade direction. Similarly, they can set their take profit targets at the opposite band or use a trailing stop to lock in profits as the price moves in their favor.
Conclusion
The LRMA BB trading indicator offers a powerful combination of linear regression moving averages and Bollinger bands, providing traders with valuable insights into market conditions and potential trading opportunities. By incorporating this advanced indicator into their trading strategies, traders can improve their ability to identify high-probability entry points, manage risk, and maximize profits in the dynamic world of Forex trading.
Features of LRMA BB MT4 indicator
- Platform: Metatrader 4
- Ability to change settings: Yes
- Timeframe: any from 1 Minute to Daily
- Currency pairs: any
In LRMA-BB.zip file you will find:
- LRMA_BB.ex4
Download LRMA BB MT4 indicator for free: