The MACD-OsMA on Chart MTF 2 MT4 Indicator is a highly accurate signal indicator that combines two popular oscillators, MACD and OsMA, to generate profitable Forex trading signals. The indicator displays these signals directly on the price chart, rather than in a separate window below the chart. With its multi-timeframe (MTF) functionality, customizable interpolation methods, and the ability to select readings between MACD and OsMA, the MACD-OsMA on Chart MTF 2 indicator can be a valuable addition to any trading strategy. This article will explore the features and benefits of this indicator and provide guidance on how to use it effectively in your Forex trading.
Understanding the MACD-OsMA on Chart MTF 2 MT4 Indicator
The MACD-OsMA on Chart MTF 2 indicator is a unique tool that combines the principles of the Moving Average Convergence Divergence (MACD) and the Oscillator of Moving Average (OsMA) oscillators. These two oscillators are widely used in Forex trading to identify trend direction and potential entry and exit points. By combining these oscillators, the MACD-OsMA on Chart MTF 2 indicator provides traders with an enhanced understanding of the market and more accurate trading signals.
Key Features of the MACD-OsMA on Chart MTF 2 Indicator:
- Multi-timeframe (MTF) functionality: The indicator allows traders to view signals from multiple timeframes on a single chart, enabling them to assess the market from different perspectives and make more informed trading decisions.
- Customizable interpolation methods: Traders can choose from three interpolation methods, allowing them to optimize the indicator’s performance for their specific trading strategy and market conditions.
- Selectable readings between MACD and OsMA: The indicator allows traders to toggle between MACD and OsMA readings, providing additional flexibility and customization options.
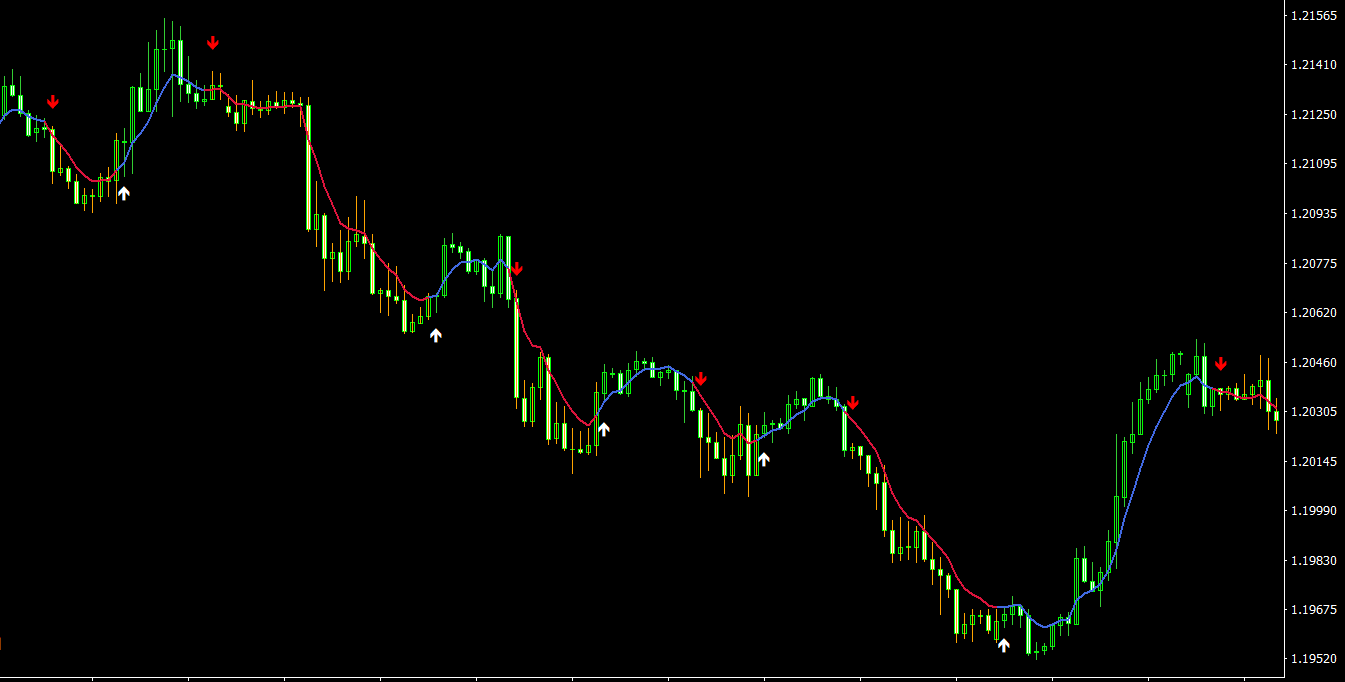
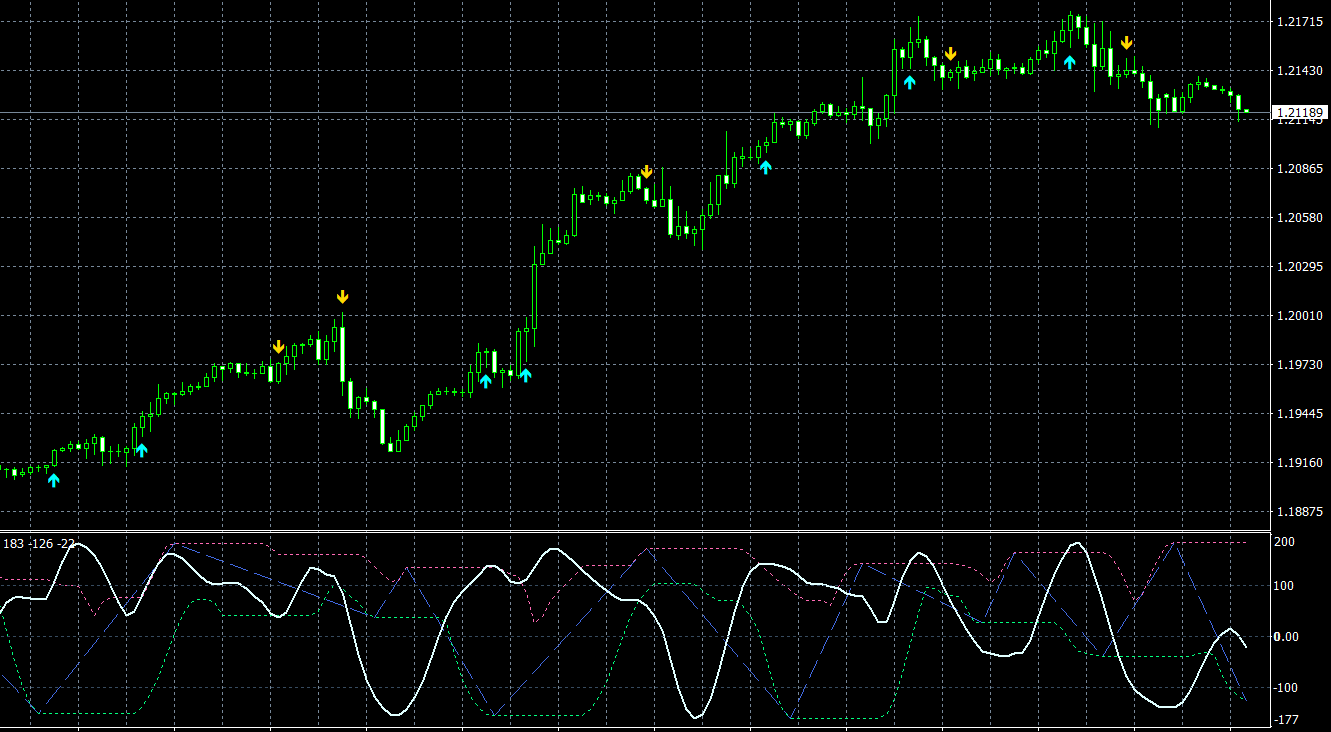
- Arrow signals on the price chart: The indicator displays buy and sell signals as arrows directly on the price chart, making it easier for traders to visualize and interpret the signals in the context of the overall market movement.
Using the MACD-OsMA on Chart MTF 2 Indicator in Forex Trading
To effectively incorporate the MACD-OsMA on Chart MTF 2 indicator into your Forex trading strategy, follow these steps:
- Install the MACD-OsMA on Chart MTF 2 indicator on your MT4 trading platform.
- Adjust the customizable parameters, such as the timeframes, interpolation methods, and readings selection, to optimize the indicator’s performance for your specific trading strategy and market conditions.
- Monitor the arrow signals on the price chart to identify potential entry and exit points. A buy signal is generated when a blue arrow appears on the chart, while a sell signal is indicated by a red arrow.
- Utilize the multi-timeframe functionality to analyze the market from different perspectives and identify more reliable trading signals. This can help you to better understand the overall trend direction and potential reversals.
- Test the indicator’s signals on a demo account before incorporating them into your live trading strategy. This will allow you to familiarize yourself with the indicator’s performance and fine-tune its settings for optimal results.
- Consider adding an additional trend filtering indicator to your trading setup to minimize false signals and enhance the accuracy of the MACD-OsMA on Chart MTF 2 indicator. This can be particularly useful in situations where the market lacks a clear direction.
Conclusion
The MACD-OsMA on Chart MTF 2 MT4 Indicator offers a powerful combination of two popular oscillators, providing traders with accurate and profitable Forex trading signals.
Features of MACD-OsMA on Chart MTF 2 MT4 indicator
- Platform: Metatrader 4
- Ability to change settings: Yes
- Timeframe: any from 1 Minute to Daily
- Currency pairs: any
In MACD-OsMA-on-Chart-MTF-2.zip file you will find:
- MACD-OsMA on Chart MTF 2.ex4
Download MACD-OsMA on Chart MTF 2 MT4 indicator for free:


