The Forex market can be a labyrinth of trend lines, indicators, and oscillators. One such oscillator that offers a powerful solution for Forex traders is the OnChart RSI of MACD MT4 indicator. This ingenious tool effectively amalgamates two standard oscillators – the Relative Strength Index (RSI) and Moving Average Convergence Divergence (MACD) – enhancing the precision of trading decisions. This comprehensive article explores the essential aspects of the OnChart RSI of MACD MT4 indicator, its functionalities, and how traders can optimize its potential in navigating the Forex market.
Understanding the OnChart RSI of MACD MT4 Indicator
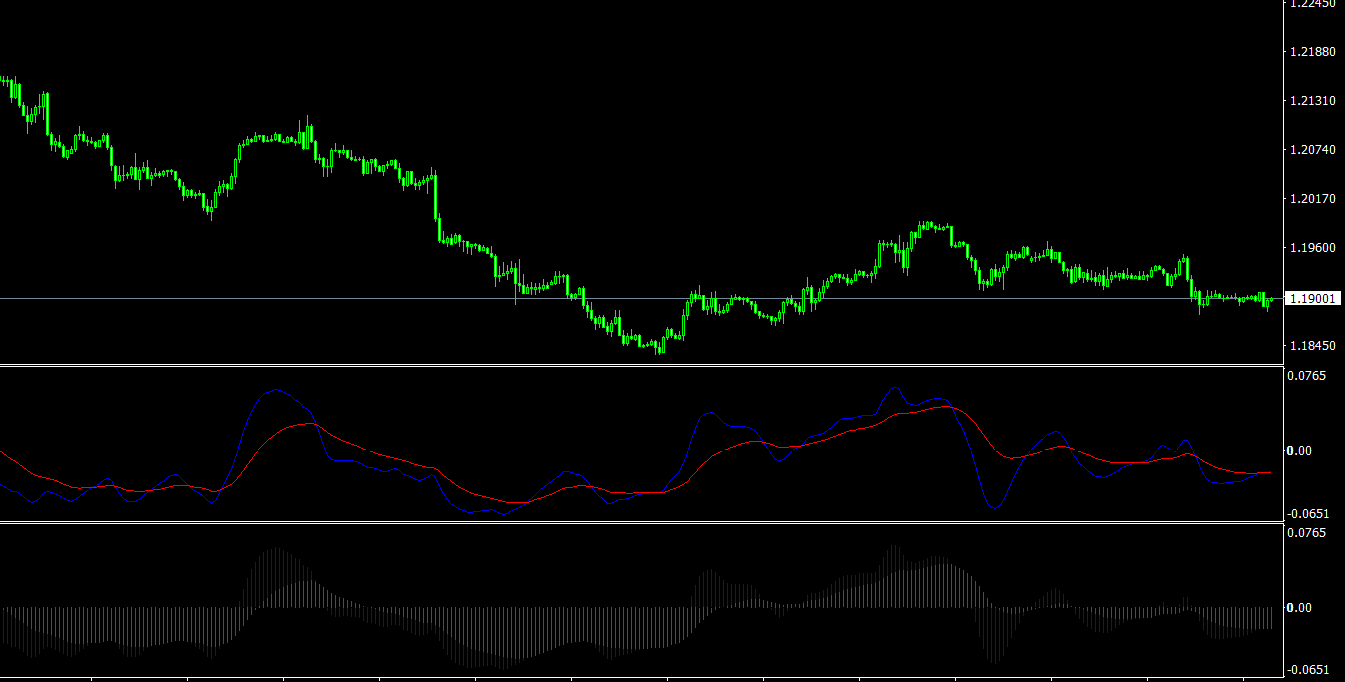
The OnChart RSI of MACD MT4 indicator is a unique blend of two classic oscillators, RSI and MACD. This combination results in an indicator that presents its findings directly on the price chart of a currency pair, allowing traders to glean information at a glance.
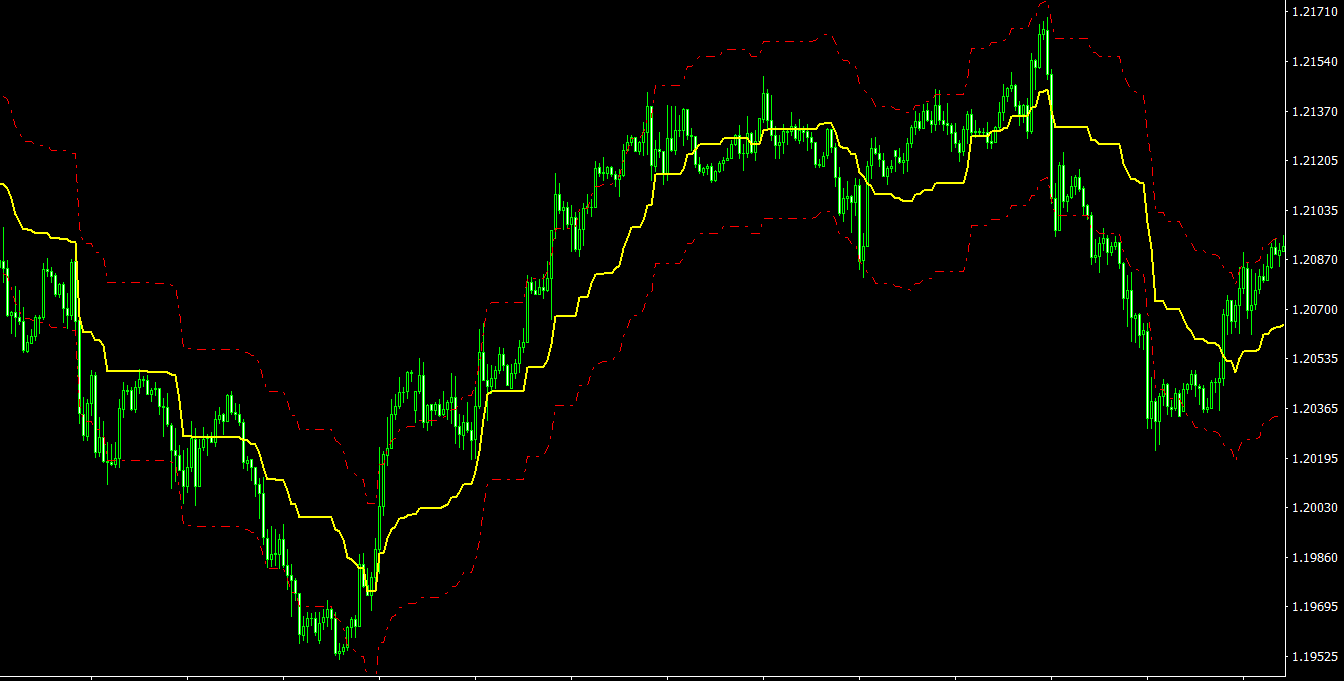
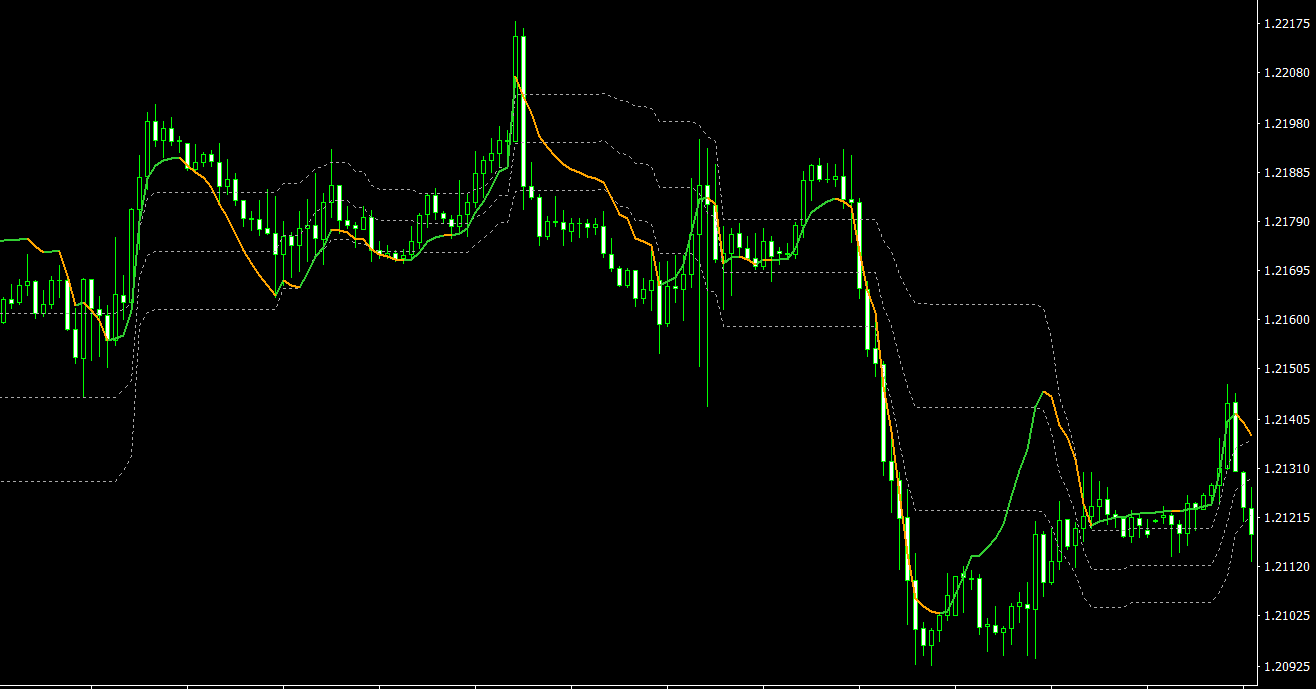
In terms of visualization, the OnChart RSI of MACD indicator plots a main line on the price chart, akin to a moving average, surrounded by a channel of three dotted lines. These lines not only indicate the direction of the trend but also serve as potential signal triggers or stop loss markers. A green main line signifies an uptrend, while an orange line represents a downtrend.
Trading with the OnChart RSI of MACD MT4 Indicator
Trading with the OnChart RSI of MACD MT4 indicator involves observing the main line color and the position of the price concerning the channel. In an uptrend (indicated by the green main line), if the price moves above the upper channel line, it can be seen as a signal to open a buy trade. Conversely, in a downtrend (marked by the orange line), if the price dips below the lower channel line, traders might consider opening a sell trade.
Notably, when the price hovers within the channel, it suggests that the market lacks a clear direction, and traders may be better off avoiding trade initiation during these periods. This visual representation provides traders with a straightforward means to understand market trends and potential entry or exit points.
The Multi-Timeframe Mode and Interpolation Function
What sets the OnChart RSI of MACD indicator apart from many others is its multi-timeframe (MTF) mode and interpolation function. The MTF mode allows traders to view multiple timeframes simultaneously, providing a broader perspective of market trends. This feature is particularly useful for those employing ‘top-down analysis’ or ‘multiple timeframe analysis’ strategies.
Meanwhile, the interpolation function aids in generating a smoother and more precise representation of the indicator values. This function is particularly helpful when using higher timeframes on lower chart periods, improving the overall accuracy of the indicator’s readings.
Conclusion
In the fast-paced Forex market, the OnChart RSI of MACD MT4 indicator offers a powerful tool to aid traders in accurately identifying price reversal points and market entry levels. Its fusion of RSI and MACD, along with its advanced user-friendly settings, MTF mode, and interpolation function, positions it as a valuable addition to any trader’s arsenal.
However, as with all trading tools, it should be used in conjunction with other MT4 indicators and a comprehensive trading plan. Doing so can help traders take full advantage of the OnChart RSI of MACD MT4 indicator’s capabilities and potentially improve their trading performance.
Features of OnChart RSI of MACD MT4 indicator
- Platform: Metatrader 4
- Ability to change settings: Yes
- Timeframe: any from 1 Minute to Daily
- Currency pairs: any
In OnChart-RSI-of-MACD.zip file you will find:
- OnChart RSI of MACD.ex4
Download OnChart RSI of MACD MT4 indicator for free: