The Parabolic Regression StopAndReverse MT4 indicator calculates the dynamic regression channel and may be considered as a mini-trading system.
The indicator Parabolic Regression StopAndReverse is created based on some popular and very useful programs, scripts and experts.
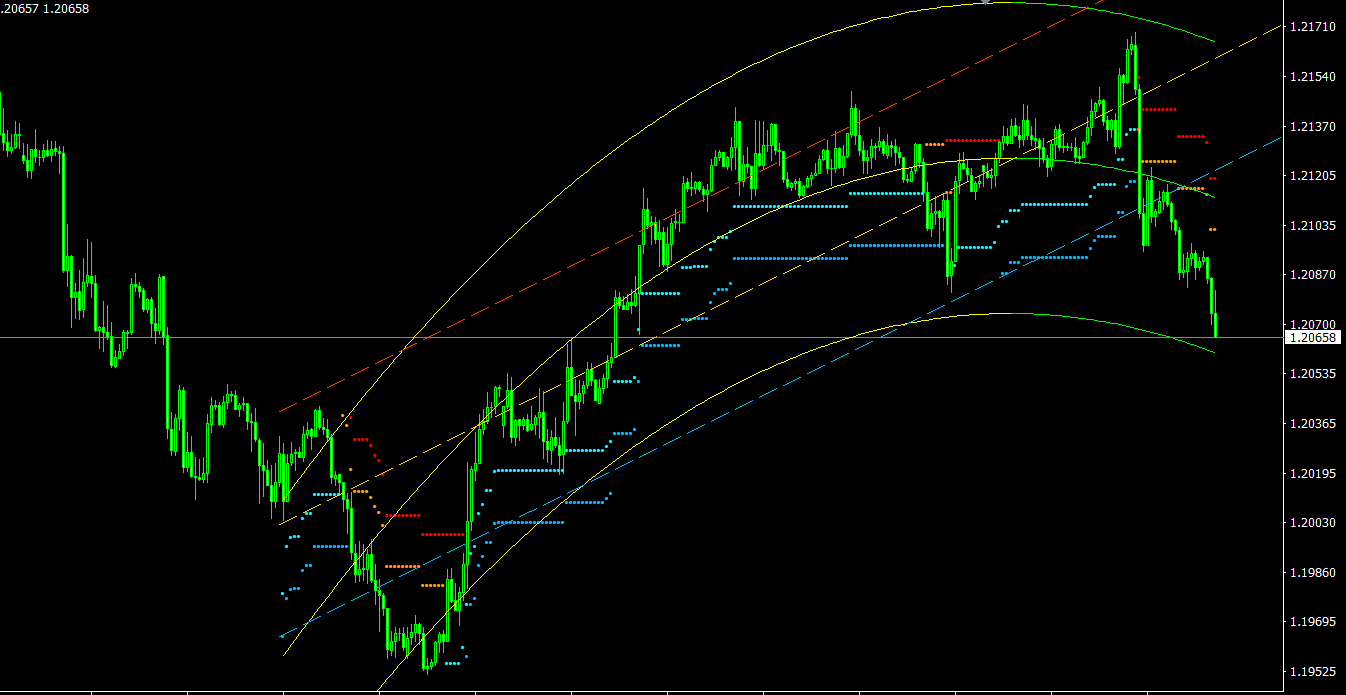
When launched, the Parabolic Regression StopAndReverse indicator automatically determines the timeframe, calculates two types of regression on the current timeframe and calculates the root-mean-square price deviation for this range. First of all, the straight gold line is important for us – the first degree regression line, which shows the direction and state of the current true trend on the selected timeframe. It is clear that the greater the angle, the stronger the trend. Thus, we are able to draw some conclusions regarding the state of the currency pair based on the current location of the price relative to the regression line. For example, in the most general case, if the ray is ascending and the price is below the ray, this indicates the recent end of a minor correction, and we should expect the price to move naturally to the area above the regression ray as part of the trend continuation.
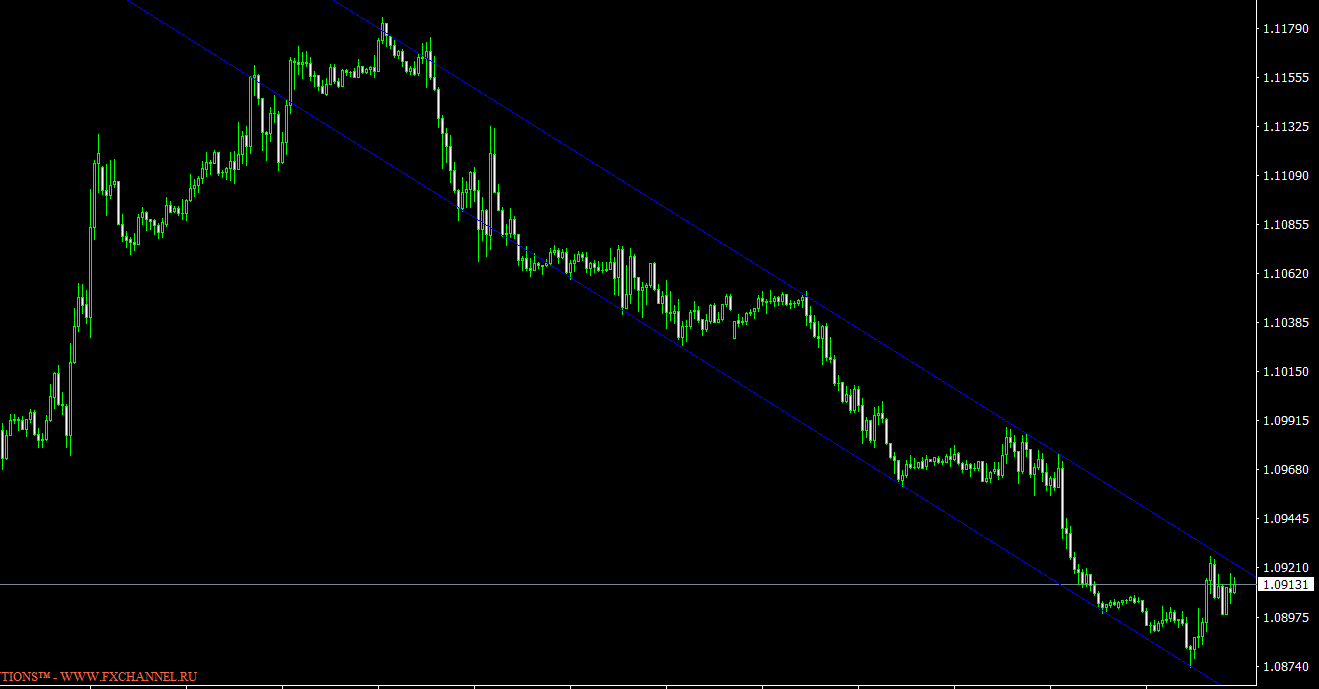
At some distance from the gold line, there are parallel support and resistance lines along the trend. They are, respectively, below and above the trend line. These are valid linear thresholds as they are plotted against the RMS deviation over the calculated range with the appropriate Fibonacci coefficient.
Using the value of the root-mean-square deviation and the corresponding Fibonacci ratios, the indicator calculates the values of the adaptive “stop” and “stop / reversal” levels for the current price. These levels can be interpreted as instantaneous limit values of deviation in the time section of the last bar. These values are shown as multi-colored dots above and / or below the price in accordance with the state of the currency pair.
Points of blue shades are drawn below the price, the lighter ones are “stop”, the darker ones are “stop / reversal”. Red dots are drawn above the price and also show stop and reversal levels. For any price value on any bar, the indicator always displays only two levels of instantaneous values, and not all four. This helps to draw appropriate conclusions about the state of the trend. An important detail – if one or two stop levels are actually broken through, when the bar closing price goes beyond the corresponding level, the indicator displays this event as a reverse of instantaneous values - for example, if these were resistance levels before breaking through, then after breaking through the indicator draws instant support levels instead. Thus, if you see a reversal, this is at least a short-term trend change into a minor correction.
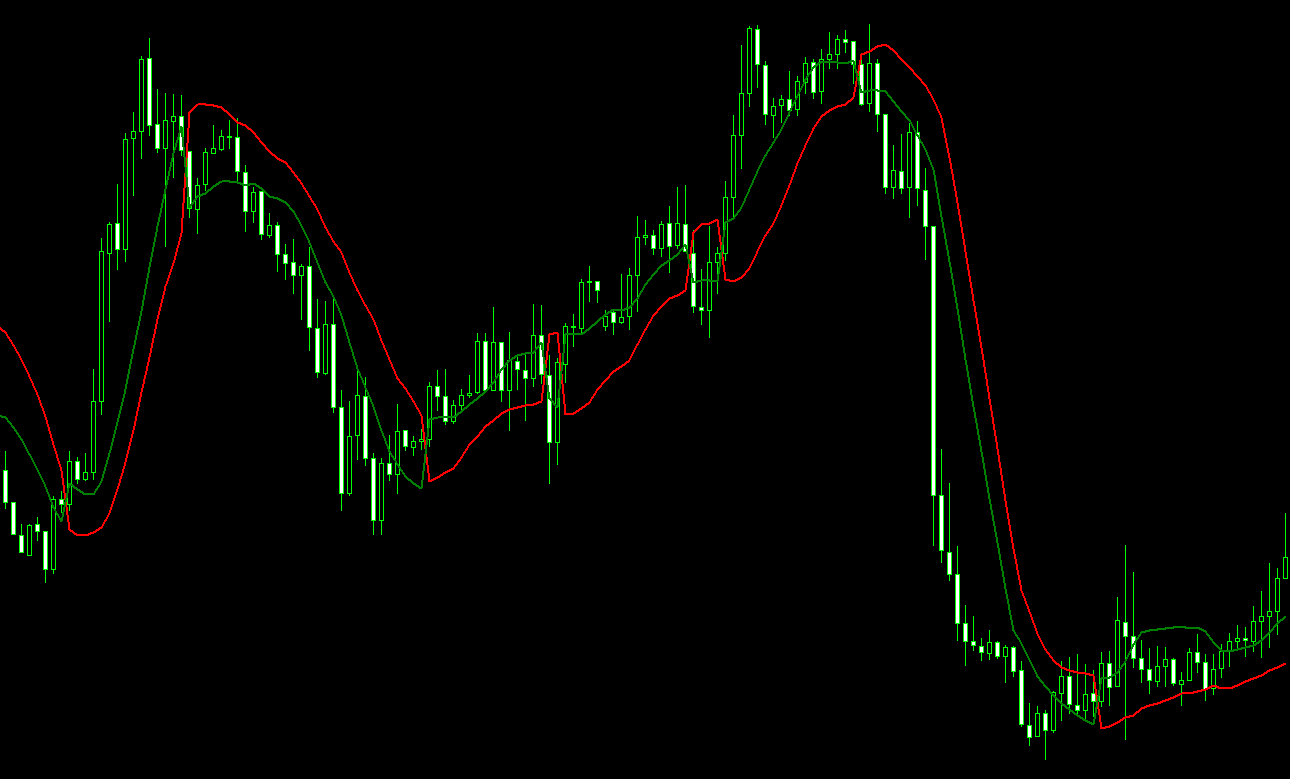
According to the given regression coefficient, the corresponding non-linear channel is calculated and displayed, which is necessary to predict the near future, and in addition, it performs the same role as the linear channel, that is, the display of actual support and resistance levels, but dynamically and non-linearly changing over time. The default is the parabolic regression coefficient, which is 2.
Input parameters
- _RegressionDegree – degree of nonlinear regression; suitable values are 2 or 3.
- _K_DeviationChannel – deviation multiplier (not Fibonacci coefficient!); allows you to set a multiplier to the deviation, an appropriate value is 2, but the value 3 may be useful to someone.
The interpretation of the indicator readings is relatively simple:
- Let’s say the nonlinear regression channel bends and crosses the gold uptrend line from top to bottom. This is a signal of exhaustion – a correction or even a trend change should be expected.
- If it crosses it from the bottom up, this is a signal that the trend strength is growing.
With a downtrend, everything is, accordingly, the opposite. You also need to switch to the higher and lower timeframes and see the situation there.
If the price crosses the support or resistance lines:
- If the price bounced over the resistance in an uptrend, you should expect it to return to the channel, but you don’t have to close your orders.
- If the price jumps out of support during an uptrend, a strong correction should be expected if it breaks both stop / reversal levels.
For a more accurate understanding of the situation, it is also necessary to take into account the state of the channel relative to the golden trend line, and the readings on adjacent time frames. Accordingly, in a downtrend, the opposite is true.
All channels are dynamically recalculated and redrawn with each new bar, depending on the current market situation. Despite the rather complicated mathematics, the Parabolic Regression StopAndReverse indicator does not load the processor at all and does not require special computer resources.
Features of Parabolic Regression StopAndReverse MT4 indicator
- Platform: Metatrader 4
- Ability to change settings: Yes
- Timeframe: any from 1 Minute to Daily
- Currency pairs: any
In ParabolicRegression_StopAndReverse.zip file you will find:
- ParabolicRegression_StopAndReverse.ex4
Download Parabolic Regression StopAndReverse MT4 indicator for free: