Oscillator indicators are essential tools for forex traders looking to gain an edge in predicting market trends and future price movements. These technical analysis instruments provide insight into the momentum, velocity, and strength of price fluctuations in currency markets. In this article, we will discuss the various oscillator indicators available to forex traders, their primary functions, and how to effectively use them to maximize your trading potential.
What are Oscillator Indicators?
Oscillator indicators are mathematical tools derived from price or volume data and used in technical analysis to predict potential price reversals or identify overbought and oversold market conditions. By oscillating between a set range, usually 0 to 100, these indicators generate buy and sell signals, helping traders make informed decisions about their trades.
There are several oscillator indicators used by forex traders, each with its unique features, advantages, and drawbacks. Some of the most popular oscillator indicators include:
- Relative Strength Index (RSI)
- Stochastic Oscillator
- Moving Average Convergence Divergence (MACD)
- Commodity Channel Index (CCI)
- Rate of Change (ROC)
- Williams %R
Relative Strength Index (RSI)
Developed by J. Welles Wilder Jr., the Relative Strength Index (RSI) is a widely-used oscillator indicator that measures the speed and change of price movements. It ranges from 0 to 100 and is typically used to identify overbought or oversold market conditions.
An RSI value above 70 is considered overbought, indicating that the currency pair may be due for a price correction or reversal. Conversely, an RSI value below 30 is considered oversold, suggesting that the price may soon rise.
Stochastic Oscillator
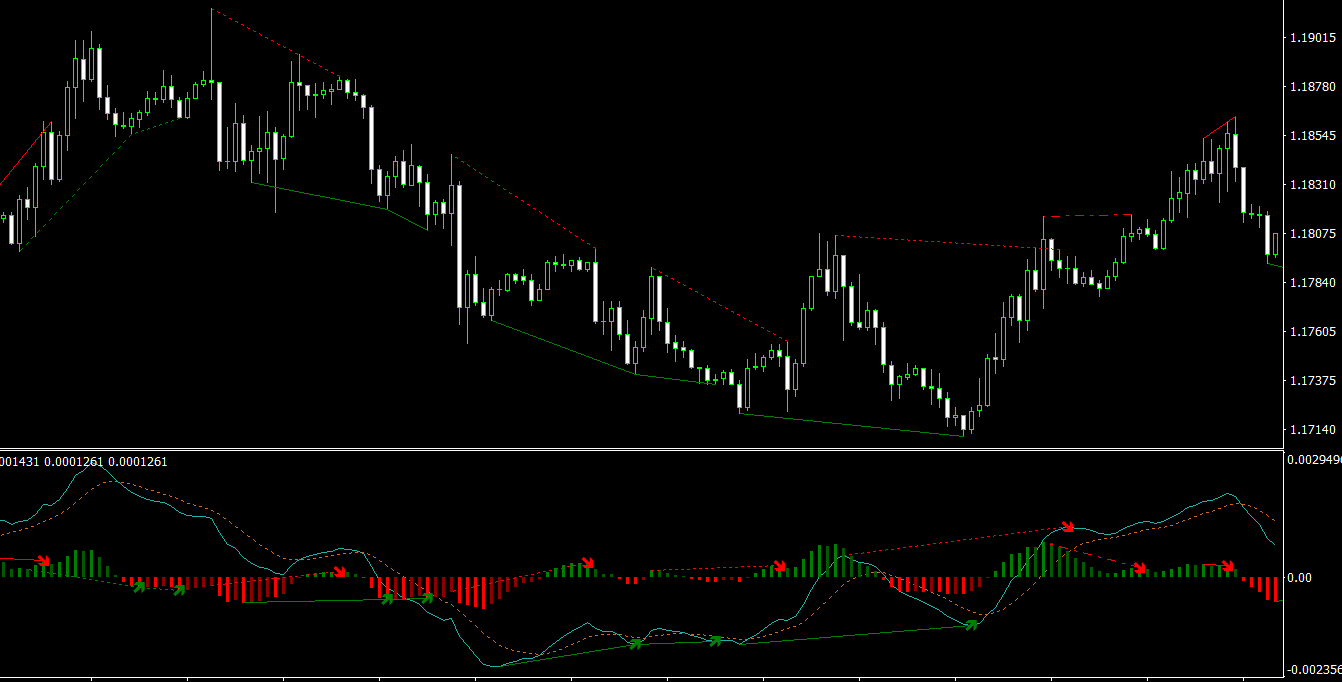
The Stochastic Oscillator, created by George Lane, is another popular indicator that compares a currency’s closing price to its price range over a specific period. This oscillator is made up of two lines, %K and %D, which fluctuate between 0 and 100. The Stochastic Oscillator generates signals based on the crossover of these two lines.
A buy signal occurs when the %K line crosses above the %D line, while a sell signal occurs when the %K line crosses below the %D line. Moreover, similar to the RSI, the Stochastic Oscillator considers values above 80 as overbought and values below 20 as oversold.
Moving Average Convergence Divergence (MACD)
The Moving Average Convergence Divergence (MACD) is a trend-following oscillator indicator developed by Gerald Appel. It is calculated by subtracting the 26-day Exponential Moving Average (EMA) from the 12-day EMA. A 9-day EMA of the MACD, known as the “signal line,” is plotted alongside the MACD to help identify buy and sell signals.
A buy signal is generated when the MACD crosses above the signal line, while a sell signal is generated when the MACD crosses below the signal line. Furthermore, the MACD can also be used to identify potential trend reversals by observing divergence between the price and the MACD line.
Commodity Channel Index (CCI)
Developed by Donald Lambert, the Commodity Channel Index (CCI) is an oscillator indicator that measures the deviation of a currency’s price from its statistical mean. It is primarily used to identify overbought and oversold conditions as well as potential trend reversals.
A CCI value above 100 is considered overbought, indicating that the price is likely to reverse, while a value below -100 is considered oversold, suggesting that the price may rise. Traders can also use CCI divergences to identify potential trend reversals.
Rate of Change (ROC)
The Rate of Change (ROC) is a momentum oscillator that measures the percentage change in price between the current period and a specified number of periods in the past. The ROC can be used to identify overbought and oversold conditions, as well as the strength of the prevailing trend.
A rising ROC indicates a bullish market, with prices increasing at an accelerating pace, while a falling ROC signifies a bearish market, with prices decreasing at an accelerating pace. Divergences between the ROC and the price can also help traders spot potential trend reversals.
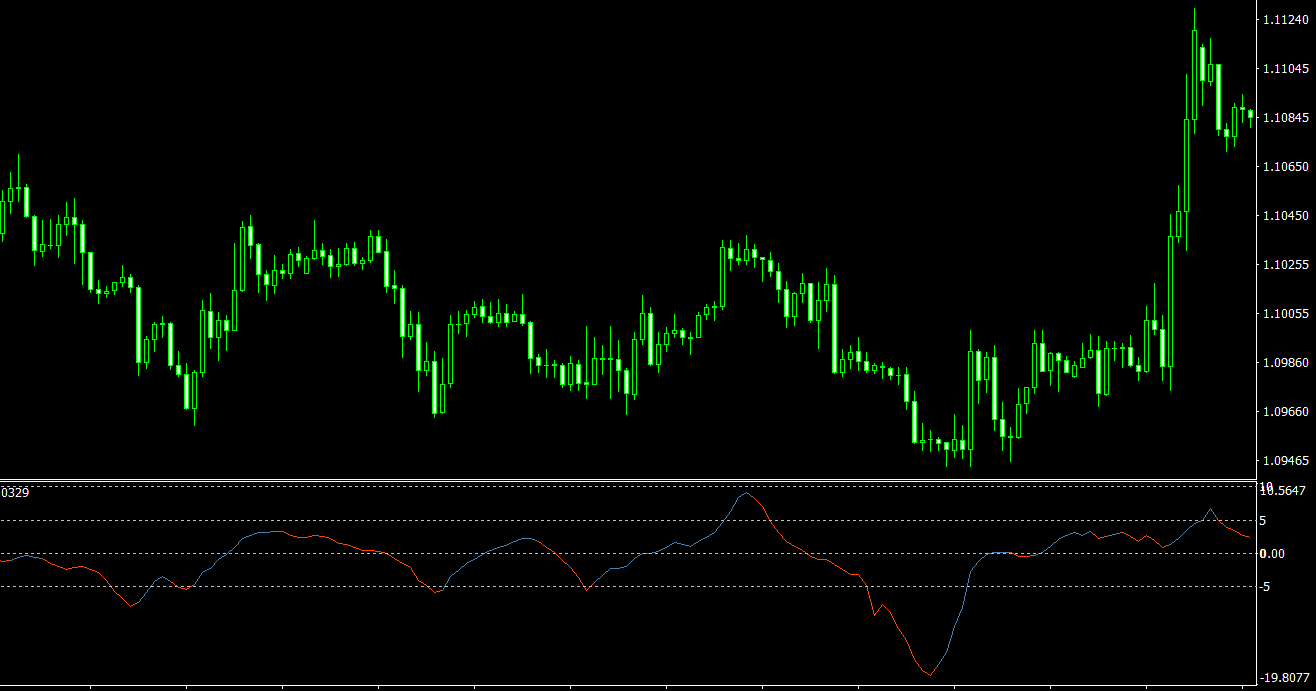
Williams %R
Developed by Larry Williams, the Williams %R is a momentum oscillator that measures the relationship between a currency’s closing price and its price range over a specific period. Like the Stochastic Oscillator, the Williams %R ranges between 0 and -100 and is primarily used to identify overbought and oversold market conditions.
A Williams %R value above -20 is considered overbought, suggesting that the price may be due for a correction or reversal. On the other hand, a value below -80 is considered oversold, indicating that the price may soon rise.
Using Oscillator Indicators in Forex Trading
Oscillator indicators can be valuable tools for forex traders seeking to maximize their profits and minimize their risks. By identifying overbought and oversold conditions, potential trend reversals, and divergence patterns, these indicators can help traders make more informed decisions about when to enter and exit trades.
When using oscillator indicators in forex trading, it’s essential to follow these steps:
- Choose the appropriate oscillator indicator(s): Each oscillator has its unique characteristics and is suited to specific market conditions. Therefore, it’s crucial to select the oscillator(s) that best align with your trading strategy and the market environment.
- Understand the oscillator’s signals: Familiarize yourself with the oscillator’s buy and sell signals, as well as any additional information it may provide, such as divergences or trend strength. This knowledge will enable you to make informed decisions based on the oscillator’s readings.
- Use multiple timeframes: Analyzing currency pairs on multiple timeframes can provide a more comprehensive view of the market, helping you to identify potential trading opportunities more effectively. For example, you may use a longer timeframe to assess the overall trend and a shorter timeframe to pinpoint entry and exit points.
- Combine oscillator indicators with other technical analysis tools: While oscillator indicators can be powerful on their own, combining them with other technical analysis tools, such as trend lines, support and resistance levels, and chart patterns, can enhance their effectiveness and provide additional confirmation for your trading decisions.
- Practice risk management: Even with the most accurate oscillator indicators, there is always a degree of uncertainty in forex trading. It is crucial to practice sound risk management strategies, such as setting stop-loss orders and managing your position sizes, to protect your capital and ensure long-term trading success.
Conclusion
Oscillator indicators can be an invaluable asset to forex traders looking to gain an edge in predicting market trends and future price movements. By understanding the various oscillator indicators and how to effectively use them in conjunction with other technical analysis tools, traders can maximize their potential for success in the forex market.