Forex trading often involves analyzing intricate price movements and patterns. Traders need reliable tools to gauge the market’s direction and make informed decisions. One such useful tool is the Pulse Fibonacci Pivot MT4 Indicator, which combines pivot points with Fibonacci levels to help identify potential support and resistance zones.
Introduction to Pulse Fibonacci Pivot Indicator
The Pulse Fibonacci Pivot indicator is specially designed for those who use Fibonacci levels in their trading strategy. It utilizes the Fibonacci sequence to calculate and display support and resistance levels on the currency pair chart. The indicator focuses on intraday trading and helps in pinpointing possible entry and exit points for traders.
Pivot Levels and Their Significance
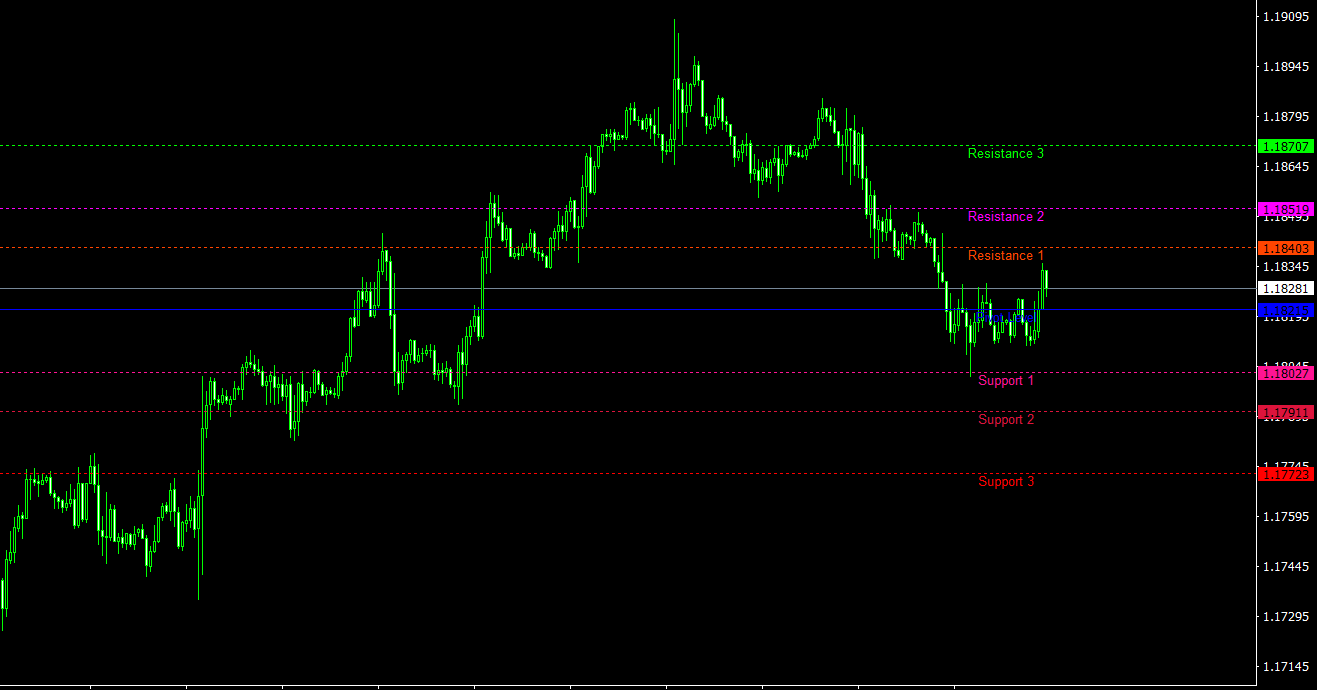
Pivot levels are vital in understanding market trends. The core pivot level, represented by a blue line, is calculated as the average price for the current day. Around this pivot level, the Pulse Fibonacci Pivot indicator displays three nearest support and resistance levels. These levels serve as crucial markers for traders and indicate potential reversal or continuation of trends.
Integration with Fibonacci Levels
Fibonacci levels are derived from the Fibonacci sequence, a set of numbers where each number is the sum of the two preceding ones. In trading, Fibonacci levels often indicate significant support and resistance points. By combining these levels with pivot points, the Pulse Fibonacci Pivot indicator provides more refined and probable areas where price action might change.
Applications in Intraday Trading
The Pulse Fibonacci Pivot MT4 indicator is specifically valuable for intraday traders. Intraday trading involves making multiple trades within a single day, profiting from small price movements. Here’s how this indicator can be applied:
1. Identifying Entry Points
The support and resistance levels shown by the Pulse Fibonacci Pivot indicator can act as entry points. When the price approaches a support level, it could be an opportunity to enter a long position, anticipating the price to bounce back up. Similarly, as the price nears a resistance level, one might consider entering a short position.
2. Setting Stop Loss and Take Profit
Knowing where the support and resistance levels lie, a trader can set strategic stop loss and take profit points. Setting a stop loss just below a support level or above a resistance level can protect against substantial losses. Conversely, take profit points can be set just before these levels, capitalizing on the price reversals.
3. Assessing Market Sentiment
The distance between the pivot level and support or resistance levels can also give an insight into market sentiment. Wider gaps might suggest stronger trends, while narrower gaps could indicate a more range-bound market.
Limitations and Considerations
While the Pulse Fibonacci Pivot MT4 Indicator is a powerful tool, it’s essential to note that it doesn’t allow for any customization of its settings. Traders should also be cautious not to rely solely on this indicator. It is best used in conjunction with other MT4 indicators and market analysis techniques.
Conclusion
The Pulse Fibonacci Pivot MT4 Indicator is an amalgamation of pivot points and Fibonacci levels, offering a significant advantage for intraday traders. While it doesn’t allow for customization, its ability to highlight potential support and resistance levels can be invaluable. As with any trading tool, it’s imperative to use the Pulse Fibonacci Pivot indicator as part of a comprehensive trading strategy, considering the inherent risks and unpredictability of the Forex market.
Features of Pulse Fibonacci Pivot MT4 indicator
- Platform: Metatrader 4
- Ability to change settings: No
- Timeframe: any from 1 Minute to Daily
- Currency pairs: any
In Pulse-Fibonacci-Pivot.zip file you will find:
- Pulse-Fibonacci-Pivot.ex4
Download Pulse Fibonacci Pivot MT4 indicator for free: