The RSI Divergence v2 MT4 Indicator is an advanced technical analysis tool that automatically identifies and plots RSI divergences on the price chart. Relative Strength Index (RSI) divergences can be powerful signals for potential trend reversals, providing traders with valuable opportunities to enter or exit trades. In this comprehensive article, we explore the features of the RSI Divergence v2 MT4 Indicator and how to use RSI divergences effectively in forex trading, with practical examples.
Overview of the RSI Divergence v2 MT4 Indicator
The RSI Divergence v2 MT4 Indicator is a sophisticated forex trading tool designed to automatically detect and display RSI divergences on the chart. RSI divergences occur when the price and RSI move in opposite directions, indicating a potential reversal in the trend. By automating the process of finding RSI divergences, the indicator saves traders time and effort, allowing them to focus on making informed trading decisions.
Types of RSI Divergences Detected by the Indicator
The RSI Divergence v2 MT4 Indicator identifies two types of RSI divergences:
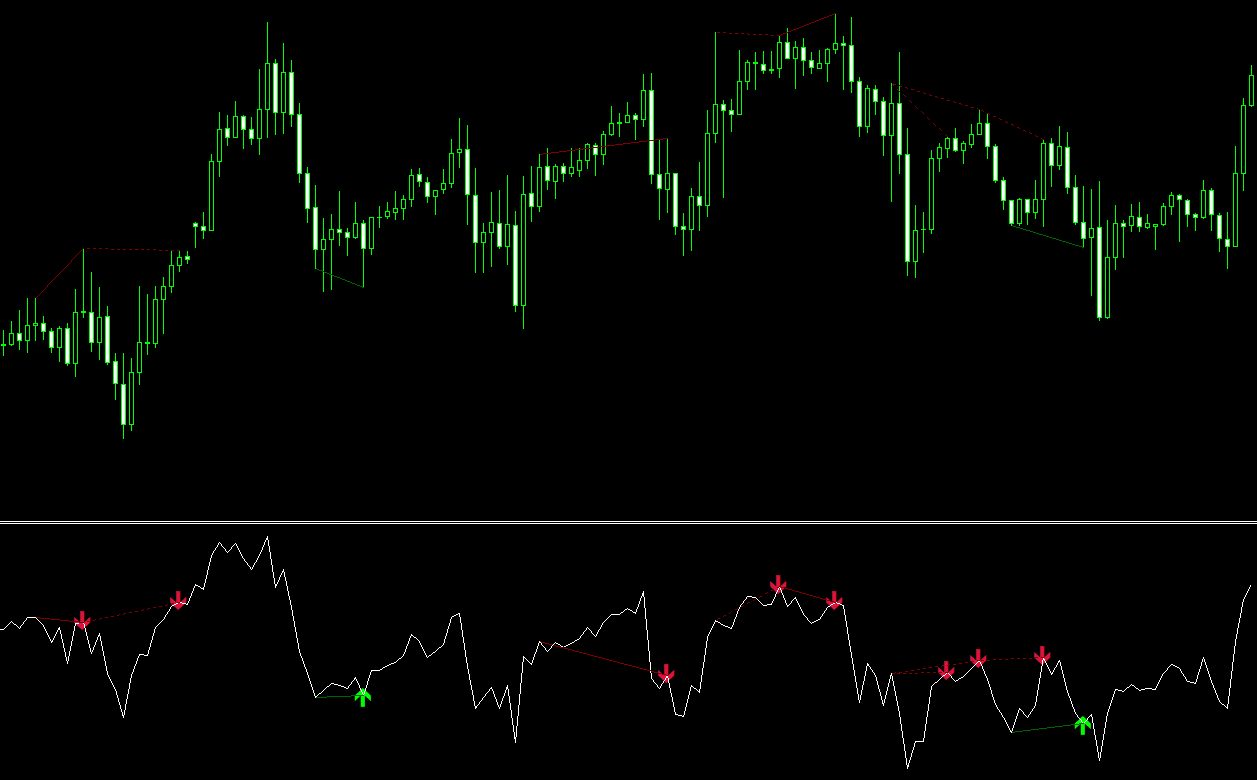
1. Regular RSI Divergence: This type of divergence occurs when the price makes higher highs (in an uptrend) or lower lows (in a downtrend), while the RSI makes lower highs or higher lows, respectively. Regular RSI divergences suggest a potential trend reversal, providing traders with an opportunity to enter trades in the opposite direction of the prevailing trend.
2. Hidden RSI Divergence: This type of divergence takes place when the price makes lower highs (in an uptrend) or higher lows (in a downtrend), while the RSI makes higher highs or lower lows, respectively. Hidden RSI divergences can be seen as a signal of trend continuation, offering traders a chance to enter trades in the direction of the prevailing trend.
Using RSI Divergences in Forex Trading
RSI divergences can be a powerful tool for forex traders seeking to identify potential trend reversals or trend continuations. By recognizing these divergences, traders can make more informed decisions about their trading strategies.
Example:
Suppose a trader is monitoring the EUR/USD currency pair, and the RSI Divergence v2 MT4 Indicator identifies a regular RSI divergence, with the price making higher highs while the RSI makes lower highs. This divergence indicates a potential reversal from an uptrend to a downtrend, presenting the trader with an opportunity to enter a short position. The trader may decide to set a stop loss above the recent high and a take profit target at a previous support level or another technical analysis-based target.
Conversely, if the indicator identifies a hidden RSI divergence, with the price making lower highs in an uptrend while the RSI makes higher highs, this suggests that the prevailing uptrend may continue. In this case, the trader may consider entering a long position, with a stop loss below the recent low and a take profit target at a previous resistance level or another technical analysis-based target.
Installing and Configuring the RSI Divergence v2 MT4 Indicator
1. Installation
To install the RSI Divergence v2 MT4 Indicator, download the indicator file below and save it to your computer. Open the MetaTrader 4 platform, click on “File” > “Open Data Folder,” and navigate to the “MQL4” folder, followed by the “Indicators” folder. Copy the downloaded indicator file into the “Indicators” folder, then restart the MetaTrader 4 platform. The RSI Divergence v2 MT4 Indicator should now be available in the “Navigator” panel.
2. Applying the Indicator to Charts
To apply the RSI Divergence v2 MT4 Indicator to a chart, simply drag and drop the indicator from the “Navigator” panel onto the desired chart. A configuration window will open, allowing you to customize the settings for the RSI calculation period, and the color and style of the divergence lines. After configuring the settings, click “OK,” and the indicator will automatically calculate and plot the RSI divergences on the chart.
Advantages and Limitations of the RSI Divergence v2 MT4 Indicator
Advantages:
- Automatically identifies and plots regular and hidden RSI divergences, saving traders time and effort.
- Can be used across various timeframes and trading styles, from intraday to long-term.
- Provides a visual representation of potential trend reversals or continuations, aiding in decision-making.
Limitations:
- RSI divergences are not foolproof and may occasionally provide false signals.
- The indicator is best used in combination with other technical analysis tools or price action indicators to improve its effectiveness.
- It may be less effective during periods of low volatility or sideways market movements, as divergences may not be as clearly defined.
Conclusion
The RSI Divergence v2 MT4 Indicator is an invaluable tool for forex traders seeking to identify potential trend reversals or continuations through the analysis of RSI divergences. By automatically detecting and plotting regular and hidden RSI divergences on the chart, the indicator streamlines the trading process and saves time for traders. However, it is important to note that RSI divergences are not infallible and should be used in conjunction with other MT4 indicators or price action techniques to enhance their reliability. Overall, the RSI Divergence v2 MT4 Indicator is a valuable addition to any forex trader’s toolkit, providing essential insights into potential trading opportunities.
Features of RSI Divergence v2 MT4 indicator
- Platform: Metatrader 4
- Ability to change settings: Yes
- Timeframe: any from 1 Minute to Daily
- Currency pairs: any
In RSI_Divergence_v2.zip file you will find:
- RSI_Divergence_v2.ex4
Download RSI Divergence v2 MT4 indicator for free: