The Val Bands v3 TT MT4 Indicator is a versatile trading tool that measures candlestick length volatility and offers traders a wide range of applications. The indicator incorporates histogram and lines to display valuable information about the market’s current state, providing insights that can improve trading strategies. In this article, we will explore the key features of the Val Bands v3 TT trading indicator and discuss its applications in enhancing trading performance.
Key Features of the Val Bands v3 TT MT4 Indicator
- Candlestick Length Volatility: The Val Bands v3 TT indicator calculates the length of each candlestick in pips, providing a clear measure of market volatility.
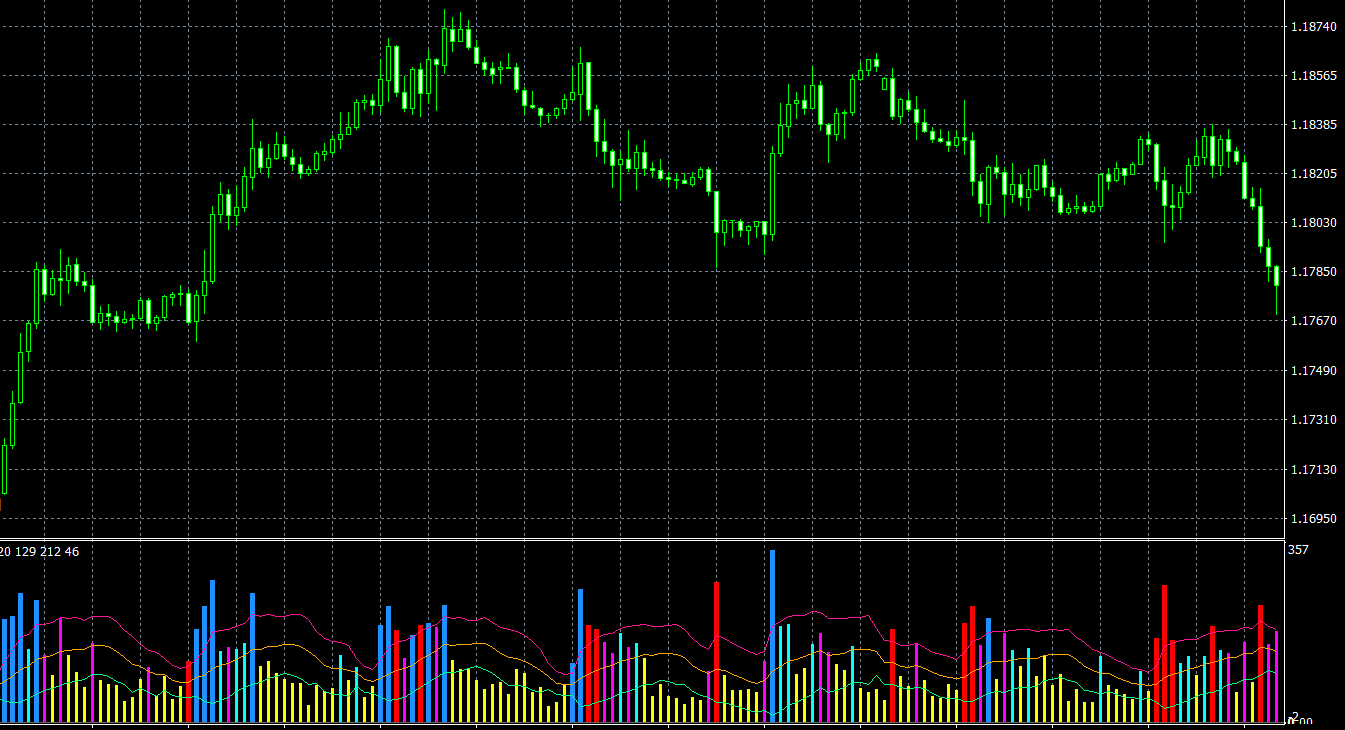
- Histogram and Lines: The indicator displays a histogram representing the candlestick length in pips and lines representing averages and signals from the length of the candles with standard deviation.
- Bollinger Channel-like Settings: The Val Bands v3 TT indicator’s settings are similar to those of the Bollinger Channel, allowing traders to fine-tune the indicator to their preferences and market conditions.
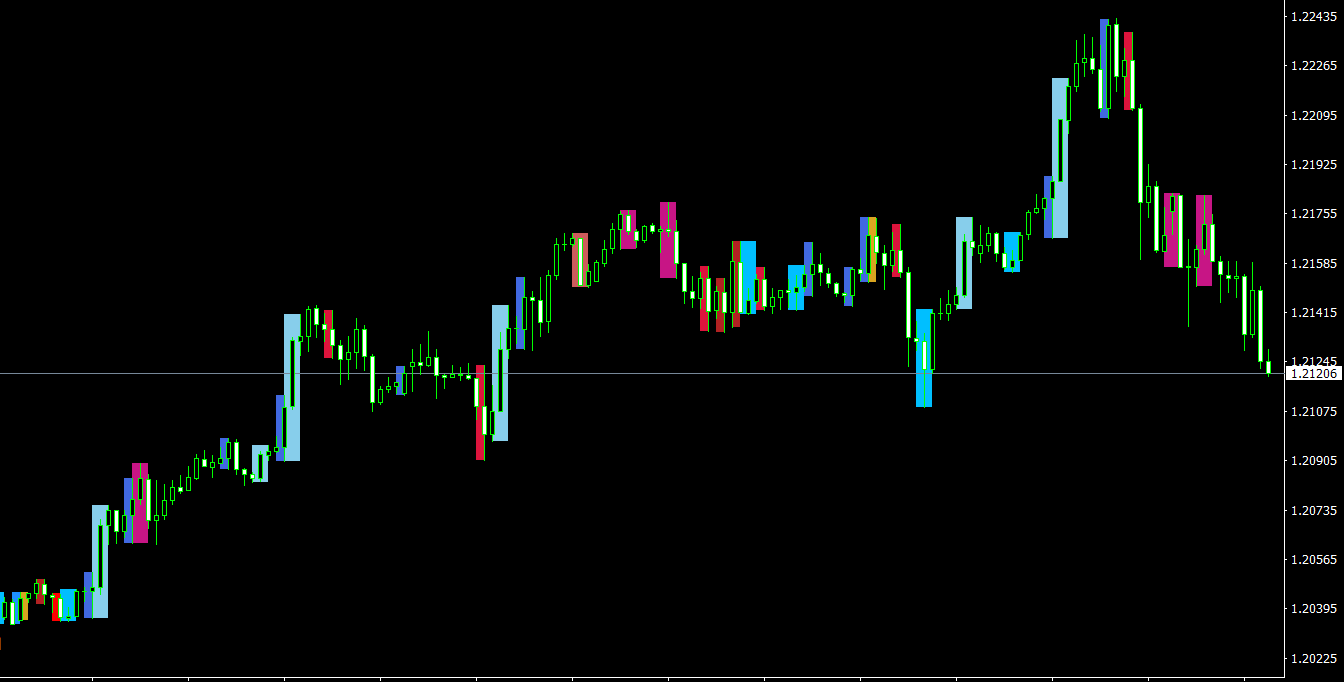
- Buy and Sell Signals: The indicator provides clear signals for potential entry points. A red histogram bar suggests a SELL entry, while a blue bar indicates a BUY signal.
Using the Val Bands v3 TT MT4 Indicator to Enhance Trading Strategies
The Val Bands v3 TT trading indicator offers valuable insights into market volatility, helping traders make more informed decisions. Here are some guidelines for using the indicator to improve your trading strategy:
- Identify Market Conditions: When the yellow histogram is below the lower line, it indicates that the market is in a flat or range-bound state. This information can be used to adjust trading strategies accordingly or avoid trading altogether if your strategy requires trending markets.
- Spot Trend Beginnings: If the histogram moves from below the lower line to above it, this signals the beginning of a new trend. Traders can use this information to enter trades early and capitalize on potential trend momentum.
- Determine Trade Entry Points: The Val Bands v3 TT indicator provides clear buy and sell signals through the color-coded histogram bars. When the histogram turns blue, consider entering a long position; conversely, when the histogram turns red, it may be time to enter a short position.
- Fine-tune Indicator Settings: Just as with the Bollinger Channel, traders can adjust the Val Bands v3 TT indicator settings to optimize its performance for their specific trading style and market conditions. Regularly review and modify the settings to ensure their continued effectiveness.
Conclusion
The Val Bands v3 TT MT4 Indicator is a powerful and versatile trading tool that measures candlestick length volatility and provides actionable insights to traders. With its clear signals and customizable settings, the indicator can significantly enhance the effectiveness of trading strategies. By following the guidelines provided in this article and continually refining your approach, you can unlock the full potential of the Val Bands v3 TT indicator and improve your trading performance.
Features of Val Bands v3 TT MT4 indicator
- Platform: Metatrader 4
- Ability to change settings: Yes
- Timeframe: any from 1 Minute to Daily
- Currency pairs: any
In Val-Bands-v3-TT.zip file you will find:
- Val Bands v3 TT.ex4
Download Val Bands v3 TT MT4 indicator for free: