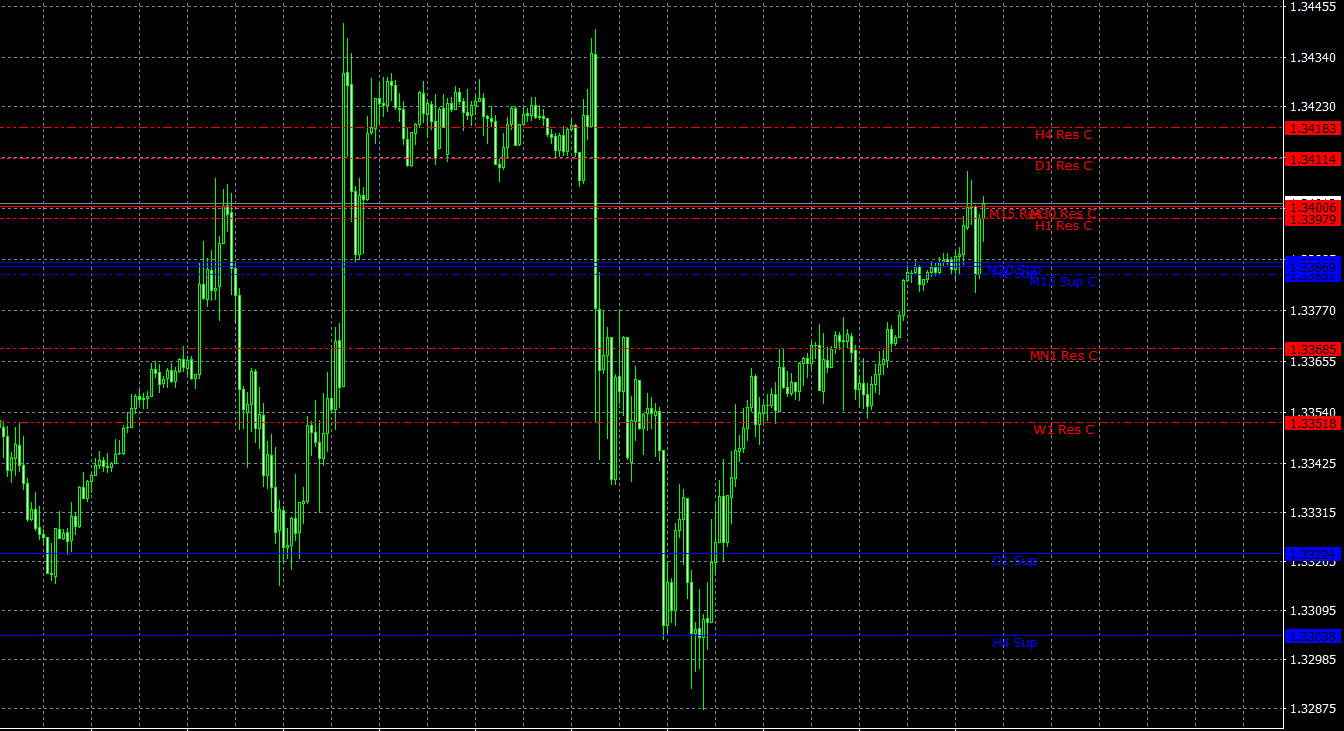
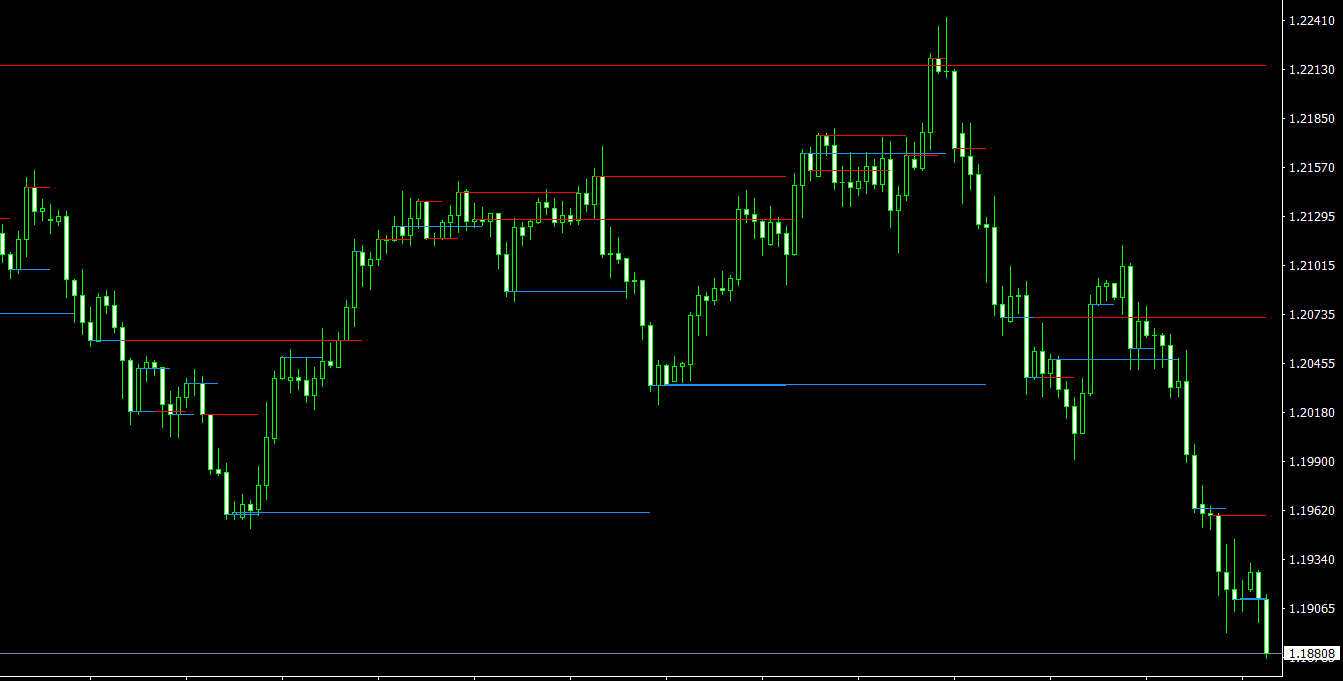
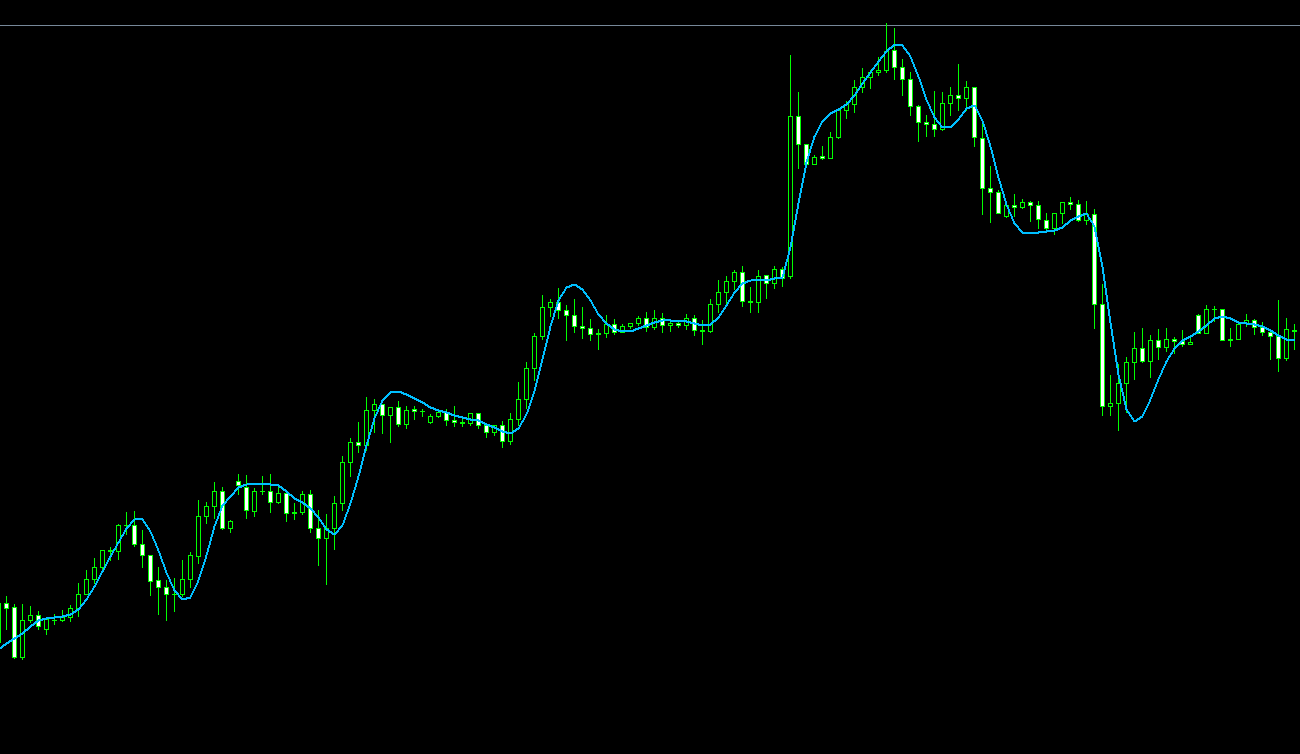
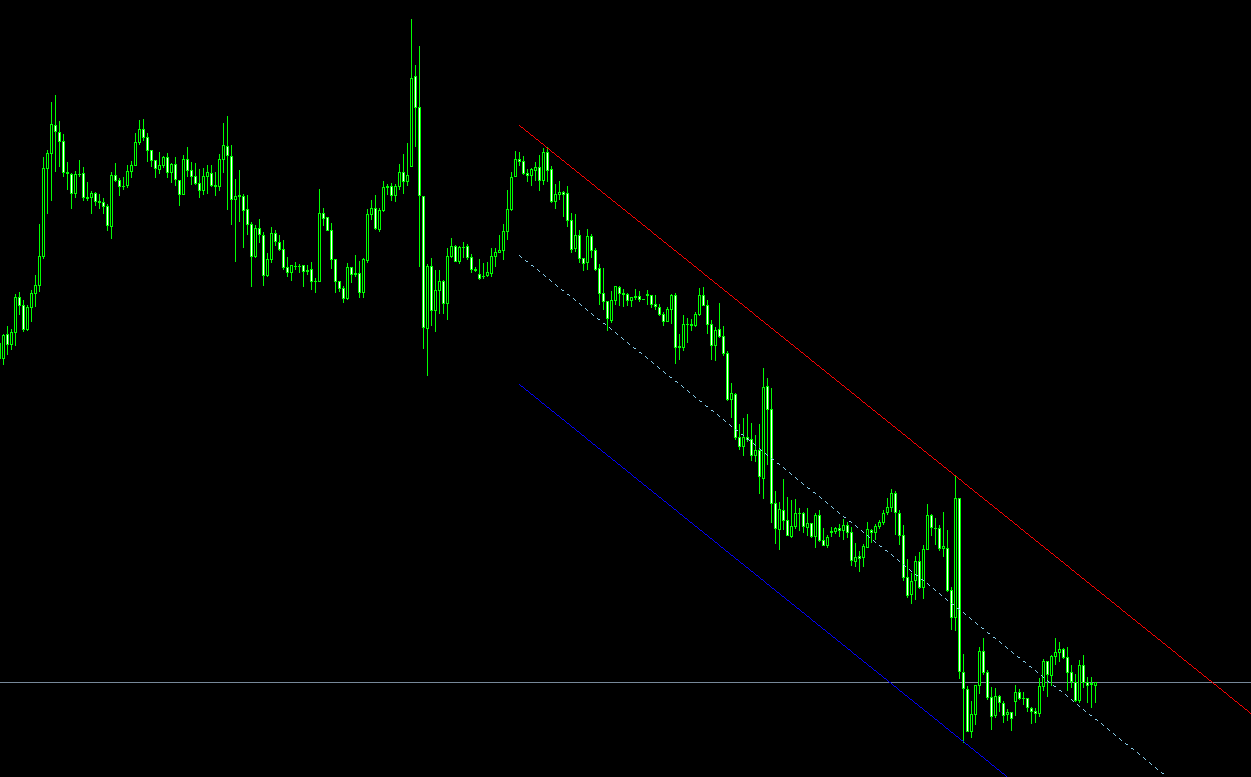
The ThreeLineBreak on Chart S/R MT4 Indicator is a unique and powerful tool that offers an interpretation of Steve Nisson’s Three Line Break strategy. It helps traders identify current and potential support and resistance levels based on closing prices. This article will discuss the key features of the ThreeLineBreak on Chart S/R MT4 Indicator, how it works, and its potential benefits for your trading strategy.
Key Features of the ThreeLineBreak on Chart S/R MT4 Indicator
- Support and Resistance Levels: The indicator displays support and resistance levels on the price chart determined by closing prices. Blue lines represent support levels, while red lines denote resistance levels. Additionally, dotted lines indicate potential support and resistance levels, providing traders with crucial information on market dynamics.
- LB Parameter: The LB parameter allows traders to set the number of levels considered for a breakout. As the price passes a certain number of points, the level lines adjust accordingly over the specified time interval.
- Higher Timeframe Display: The ThreeLineBreak on Chart S/R MT4 Indicator displays levels from higher timeframes only. This feature helps traders gain a broader perspective on market trends and make more informed decisions.
Benefits of Using the ThreeLineBreak on Chart S/R MT4 Indicator
- Enhanced Decision Making: By identifying support and resistance levels, the ThreeLineBreak on Chart S/R MT4 Indicator enables traders to make more informed decisions on entry and exit points, stop-loss placement, and profit targets.
- Improved Trading Strategy: The ability to visualize potential support and resistance levels allows traders to adapt their trading strategy accordingly, ultimately improving its overall effectiveness.
- Broader Market Perspective: By displaying levels from higher timeframes, the ThreeLineBreak on Chart S/R MT4 Indicator offers a more comprehensive understanding of market trends, enabling traders to better anticipate market movements and potential price reversals.
- Customization: The LB parameter allows traders to customize the number of levels considered for a breakout, providing a tailored approach to their trading strategy.
How to Use the ThreeLineBreak on Chart S/R MT4 Indicator
The ThreeLineBreak on Chart S/R MT4 Indicator is designed to be user-friendly and straightforward. Simply apply the indicator to your chart and configure the LB parameter to determine the number of levels taken into account for breakouts. As the price moves, the level lines will adjust accordingly, providing real-time support and resistance levels.
When utilizing this indicator, traders should consider the following:
- Monitor support and resistance levels for potential trading opportunities, including breakouts, reversals, and price rejections.
- Use the higher timeframe display to gain a broader understanding of market trends and adapt your trading strategy accordingly.
- Customize the LB parameter to align with your specific trading style and preferences.
Conclusion
The ThreeLineBreak on Chart S/R MT4 Indicator is a powerful and versatile tool for identifying crucial support and resistance levels, improving decision-making and enhancing trading strategies. By providing a broader market perspective, customizable features, and real-time level adjustments, this indicator can be a valuable addition to any trader’s arsenal. By incorporating the ThreeLineBreak on Chart S/R MT4 Indicator into your trading strategy, you can potentially increase your chances of success and maximize your trading profits.
Features of ThreeLineBreak on Chart S/R MT4 indicator
- Platform: Metatrader 4
- Ability to change settings: Yes
- Timeframe: any from M1 to Daily
- Currency pairs: any
In ThreeLineBreak-on-Chart-SR.zip file you will find:
- ThreeLineBreak on Chart SR.ex4
Download ThreeLineBreak on Chart S/R MT4 indicator for free:


