Forex indicators are technical analysis tools that help traders identify trends, support and resistance levels, and potential entry and exit points in the currency market. These indicators provide valuable insight into market conditions and enable traders to make better-informed decisions.
In this article, we will discuss various types of forex indicators, their uses, and how to effectively incorporate them into your trading strategy. By understanding how to use forex indicators, you can enhance your trading skills and increase your chances of success in the market.
Types of Forex Indicators
There are numerous forex indicators available, but they can be broadly categorized into two types: leading and lagging indicators.
1. Leading Indicators
Leading indicators are designed to predict future price movements and provide early signals before a trend change occurs. They are useful for identifying potential opportunities in the market. Some common leading indicators include:
- Relative Strength Index (RSI)
- Stochastic Oscillator
- Commodity Channel Index (CCI)
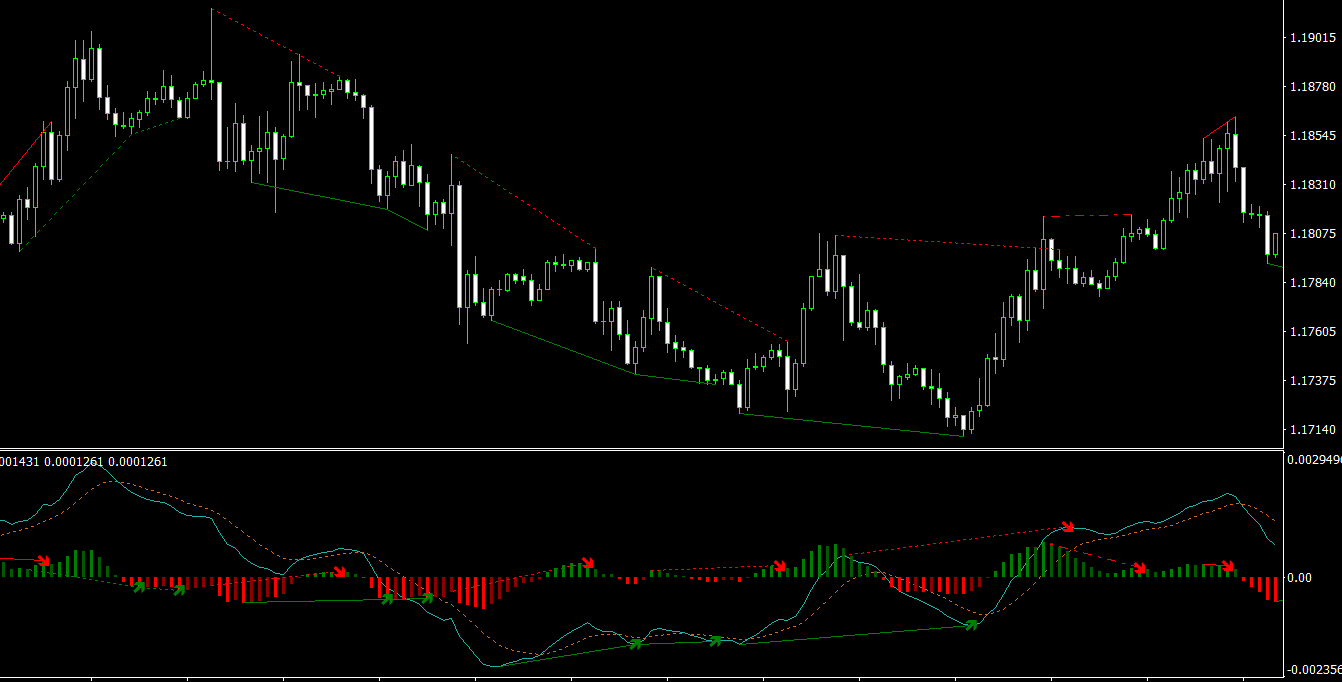
- Moving Average Convergence Divergence (MACD)
2. Lagging Indicators
Lagging indicators, on the other hand, confirm trends and price reversals after they have already occurred. These indicators are particularly useful for confirming the strength and sustainability of a trend. Some common lagging indicators include:
- Simple Moving Averages (SMA)
- Exponential Moving Averages (EMA)
- Bollinger Bands
- Parabolic Stop and Reverse (SAR)
Using Forex Indicators in Your Trading Strategy
To effectively use forex indicators, it’s essential to understand their strengths and limitations. Here are some steps to follow when incorporating forex indicators into your trading strategy:
1. Choose the Right Indicators
Select indicators that complement your trading style and strategy. For example, if you’re a trend follower, you may want to use moving averages and Bollinger Bands to identify and confirm trends. On the other hand, if you’re a reversal trader, you may prefer using RSI and Stochastic Oscillator to identify overbought and oversold conditions.
2. Understand the Signals
Familiarize yourself with the signals each indicator generates and how they relate to your trading strategy. For example, if you’re using the MACD indicator, understand how its histogram and signal lines interact to generate buy and sell signals.
3. Apply the Indicators on Multiple Timeframes
To increase the accuracy of your analysis, apply the chosen indicators on multiple timeframes. For instance, if you’re a day trader, you may want to use indicators on 15-minute, hourly, and 4-hour charts. This approach can help you identify trends and reversals with greater confidence and filter out false signals.
4. Combine Leading and Lagging Indicators
Using a combination of leading and lagging indicators can provide a more comprehensive view of the market. While leading indicators help identify potential trade opportunities, lagging indicators can confirm the validity of those signals. For example, you can use the RSI (a leading indicator) to identify oversold conditions and then wait for a moving average crossover (a lagging indicator) to confirm a potential reversal.
5. Avoid Overloading Your Charts
While using multiple indicators can provide valuable insights, it’s essential to avoid overloading your charts with too many indicators. Doing so can lead to confusion and conflicting signals. Instead, select a few indicators that work well together and provide a clear, concise analysis of the market.
6. Test and Optimize Your Strategy
Before using forex indicators in your live trading, test your strategy using historical data and a demo account. This will help you fine-tune your approach and gain confidence in your trading decisions. Additionally, continually reassess and optimize your strategy to adapt to changing market conditions and improve your overall performance.
Popular Forex Indicators and Their Uses
Here are some popular forex indicators and how to use them in your trading strategy:
1. Moving Averages (SMA and EMA)
Moving averages smooth out price data to identify trends and potential reversal points. Simple moving averages (SMA) calculate the average price over a specific period, while exponential moving averages (EMA) give more weight to recent price data.
To use moving averages in your trading:
- Identify trends: When the price is above the moving average, it indicates an uptrend, and when it’s below the moving average, it suggests a downtrend.
- Generate signals: A crossover of two moving averages can generate buy and sell signals. When a shorter-term moving average crosses above a longer-term moving average, it signals a potential buying opportunity, and vice versa.
- Identify support and resistance levels: Moving averages can also act as dynamic support and resistance levels, providing potential entry and exit points.
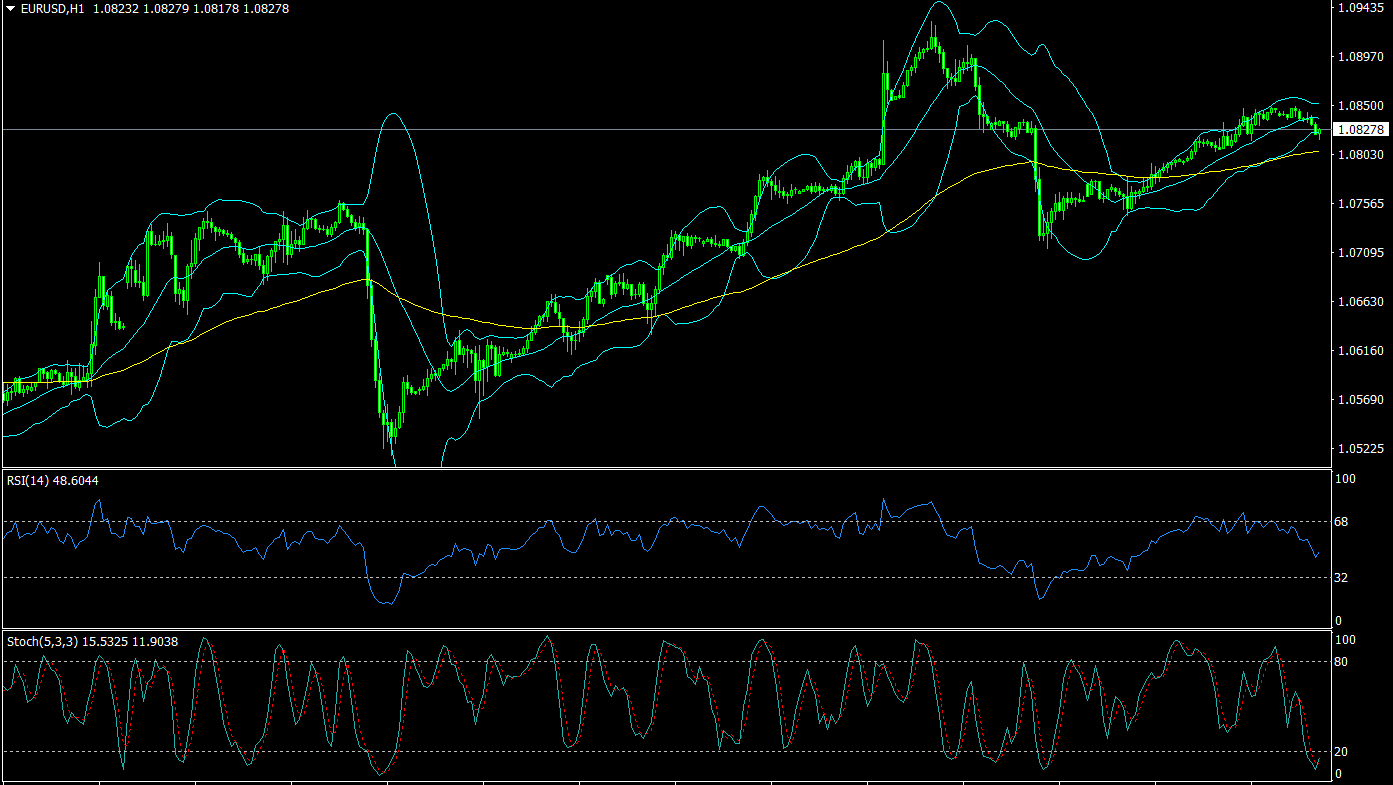
2. Relative Strength Index (RSI)
The RSI measures the speed and change of price movements, helping traders identify overbought and oversold conditions. Typically, RSI readings above 70 indicate overbought conditions, while readings below 30 suggest oversold conditions.
To use RSI in your trading:
- Identify overbought and oversold levels: When the RSI reaches extreme levels, it can signal potential reversals in the market. However, keep in mind that in a strong trend, the RSI can remain overbought or oversold for extended periods.
- Divergence: If the price makes a new high or low, but the RSI fails to do so, it can signal a potential reversal. For example, if the price makes a higher high, but the RSI makes a lower high, it indicates bearish divergence and a possible trend reversal.
3. Bollinger Bands
Bollinger Bands are volatility bands placed above and below a moving average, typically a 20-day simple moving average. The bands expand and contract based on the market’s volatility, helping traders identify potential trade opportunities.
To use Bollinger Bands in your trading:
- Identify overbought and oversold levels: When the price touches the upper band, it can signal overbought conditions, while touching the lower band may indicate oversold conditions.
- Squeeze: A Bollinger Band squeeze occurs when the bands contract and come close together. This can signal a period of low volatility, often followed by a significant price movement in either direction.
- Breakouts: When the price moves outside the Bollinger Bands, it can indicate a breakout and the beginning of a new trend. Traders can enter a trade in the direction of the breakout, but it’s essential to confirm the signal with other indicators or price action analysis.
4. Stochastic Oscillator
The Stochastic Oscillator compares the closing price of a currency pair to its price range over a specific period. It helps traders identify overbought and oversold conditions, as well as potential trend reversals.
To use the Stochastic Oscillator in your trading:
- Identify overbought and oversold levels: Readings above 80 indicate overbought conditions, while readings below 20 suggest oversold conditions. Look for potential reversals when the oscillator reaches these extreme levels.
- Generate signals: When the %K line (fast line) crosses above the %D line (slow line), it generates a buy signal, while a cross below the %D line produces a sell signal. However, it’s crucial to use these signals in conjunction with other indicators or price action analysis to filter out false signals.
- Divergence: Similar to the RSI, bullish or bearish divergence between the Stochastic Oscillator and price can signal potential trend reversals.
Conclusion
Forex indicators are powerful tools that can help traders make informed decisions in the currency market. By understanding how to use these indicators effectively, traders can improve their trading strategies and increase their chances of success. When incorporating forex indicators into your trading approach, remember to choose the right indicators for your trading style, combine leading and lagging indicators, and apply them on multiple timeframes. Additionally, avoid overloading your charts, and continually test and optimize your strategy to adapt to changing market conditions. By following these guidelines, you can enhance your trading skills and achieve better results in the forex market.