Technical analysis plays a significant role in forex trading, with traders relying on various indicators to make informed decisions and develop effective strategies. One such technical analysis tool is the Commodity Channel Index (CCI), which can help traders identify potential trading opportunities by measuring market strength and detecting overbought and oversold conditions. This article will delve into the CCI indicator, its calculation, interpretation, and how to use it effectively in forex trading.
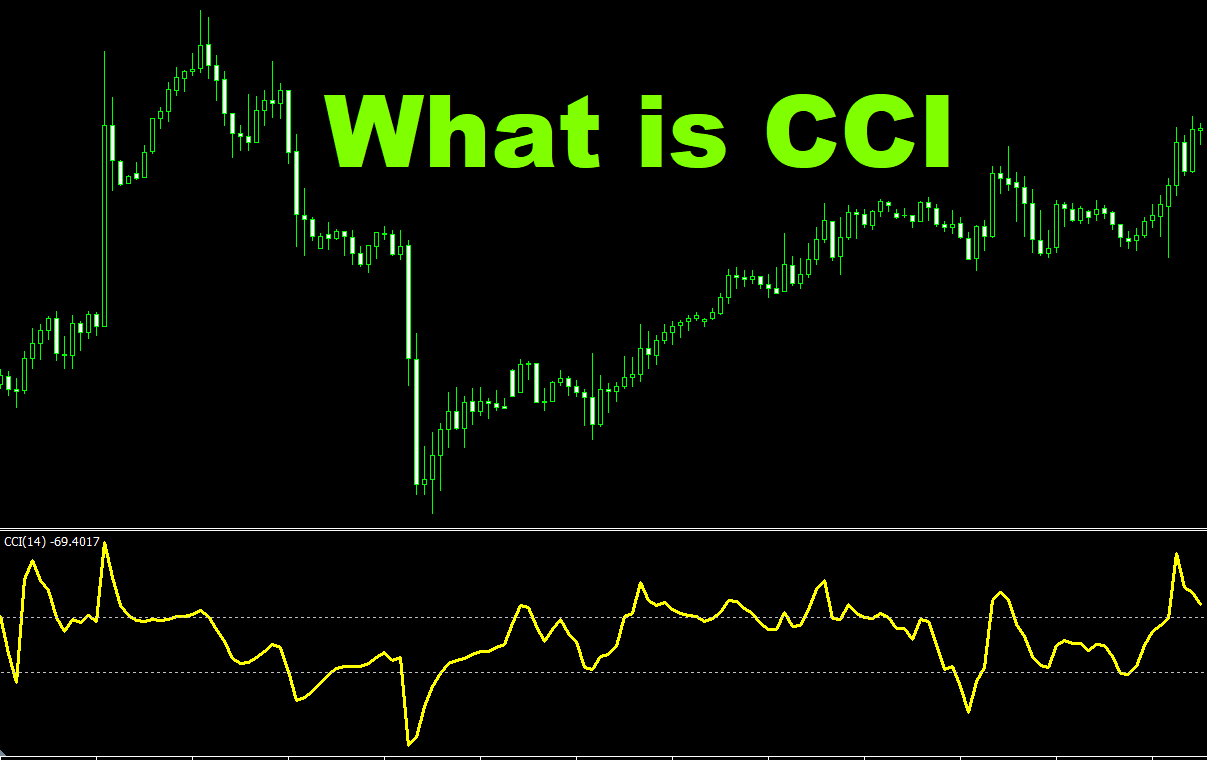
What are CCI Indicators?
The Commodity Channel Index (CCI) is a momentum-based oscillator developed by Donald Lambert in 1980. Initially intended for analyzing commodities, the CCI has become a popular indicator for various financial instruments, including forex. The CCI measures the current price level relative to an average price level over a specified period, indicating the strength of price movements and potential trend reversals.
The CCI fluctuates above and below a zero line, with positive values indicating upward momentum and negative values signaling downward momentum. By setting overbought and oversold thresholds, traders can identify potential reversals and new trading opportunities.
Calculating the CCI
The CCI calculation consists of several steps:
- Determine the Typical Price (TP) for each period: The TP is the average of the high, low, and closing prices for a specific period. TP = (High + Low + Close) / 3
- Calculate the Simple Moving Average (SMA) of the TP: The SMA is calculated over a specified number of periods, commonly 14 or 20. SMA(TP) = Sum of TPs for all periods / Number of periods
- Calculate the Mean Deviation (MD): The MD is the average of the absolute differences between each TP and the SMA(TP) over the specified period. MD = Sum of (Absolute value of TP – SMA(TP)) / Number of periods
- Compute the CCI: CCI = (TP – SMA(TP)) / (0.015 * MD)
Interpreting the CCI
The CCI has a few common interpretation methods:
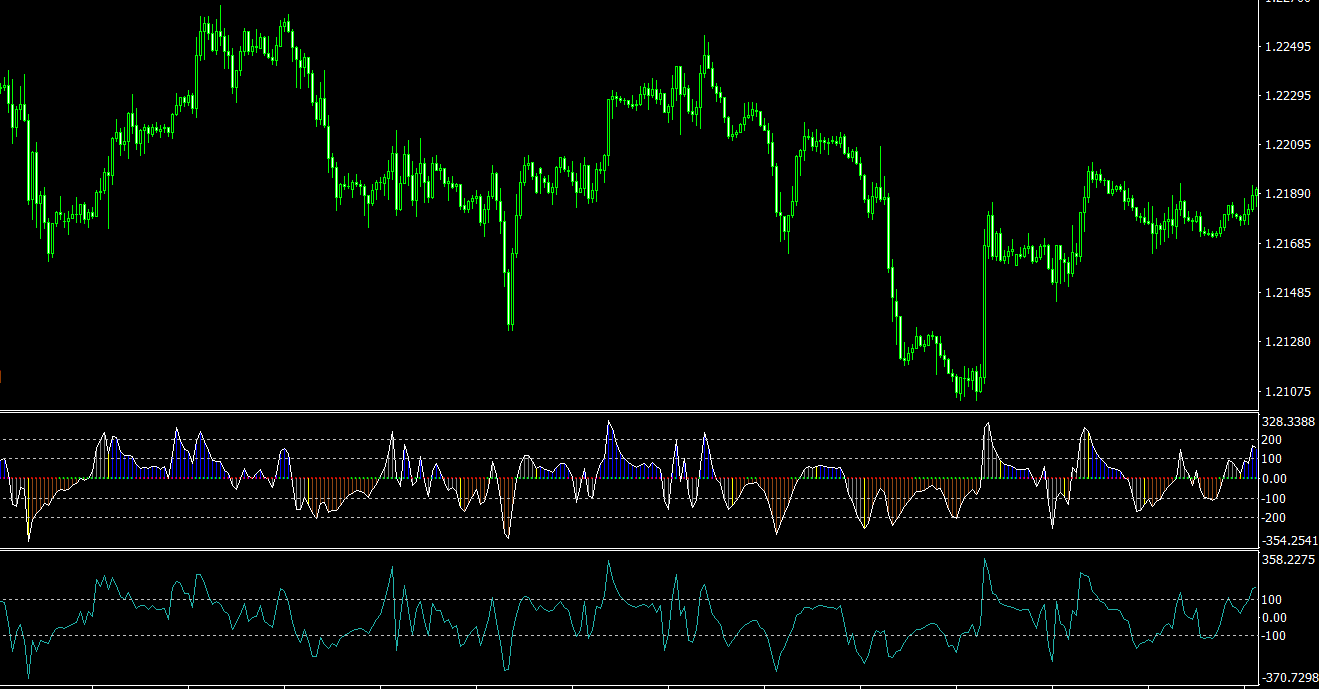
- Overbought and Oversold Levels: Traders typically consider a CCI value above +100 as overbought, signaling a potential price reversal or correction. Conversely, a CCI value below -100 is deemed oversold, indicating that the price may soon rise. When the CCI crosses these thresholds, it can generate buy or sell signals.
- Divergences: A divergence occurs when the price movement differs from the CCI movement, potentially signaling a trend reversal. For example, if the price forms a higher high while the CCI forms a lower high, it’s considered a bearish divergence, indicating that the upward momentum is weakening. Conversely, if the price forms a lower low while the CCI forms a higher low, it’s considered a bullish divergence, suggesting that the downward momentum is losing strength.
- Trend Identification: The CCI can also be used to identify the prevailing market trend. A rising CCI suggests an uptrend, while a falling CCI indicates a downtrend.
Using CCI Indicators in Forex Trading
To effectively use the CCI indicator in forex trading, consider the following tips:
- Select the appropriate timeframe: Depending on your trading strategy and style, choose the appropriate timeframe for analyzing the CCI. Short-term traders may use shorter timeframes, such as the 1-hour or 4-hour charts, while long-term traders might prefer daily or weekly charts.
- Combine the CCI with other technical analysis tools: Using the CCI in conjunction with other technical analysis tools, such as support and resistance levels, trend lines, and chart patterns, can help validate trading signals and provide additional confirmation for your trading decisions. Combining multiple indicators can enhance the effectiveness of your analysis and reduce the likelihood of false signals.
- Be mindful of divergences: Divergences between the CCI and price movements can be powerful signals of potential trend reversals. Pay close attention to these divergences and use them in conjunction with other technical analysis tools to confirm their validity.
- Use the CCI for trend identification: The CCI can help you identify the prevailing market trend, enabling you to make more informed trading decisions. For example, if the CCI is rising and above the zero line, it may indicate a strong uptrend, and you may consider looking for long positions. Conversely, if the CCI is falling and below the zero line, it may suggest a strong downtrend, and you may consider looking for short positions.
- Implement sound risk management strategies: Regardless of the reliability of the CCI or any other technical analysis tool, forex trading always involves a degree of uncertainty. It’s crucial to practice sound risk management strategies, such as setting stop-loss orders, managing your position sizes, and maintaining a diversified portfolio, to protect your capital and ensure long-term trading success.
- Test and optimize your trading strategy: Before implementing the CCI indicator in your live trading, test your trading strategy using historical data or a demo account. This process will allow you to assess the effectiveness of the CCI and other technical analysis tools in your strategy, and make any necessary adjustments to optimize performance.
Conclusion
The Commodity Channel Index (CCI) is a versatile and powerful momentum-based oscillator that can provide valuable insights into market strength and potential trend reversals. By understanding the CCI indicator’s calculation and interpretation, and incorporating it effectively into your forex trading strategy in conjunction with other technical analysis tools, you can maximize your potential for success in the forex market.