Technical analysis plays a crucial role in helping forex traders make informed decisions and develop successful trading strategies. Among the various technical analysis tools, channel indicators are highly regarded for their ability to identify trend direction, potential support and resistance levels, and market volatility. This article will discuss the concept of channel indicators, different types of channel indicators, and how to effectively use them in forex trading.
What are Channel Indicators?
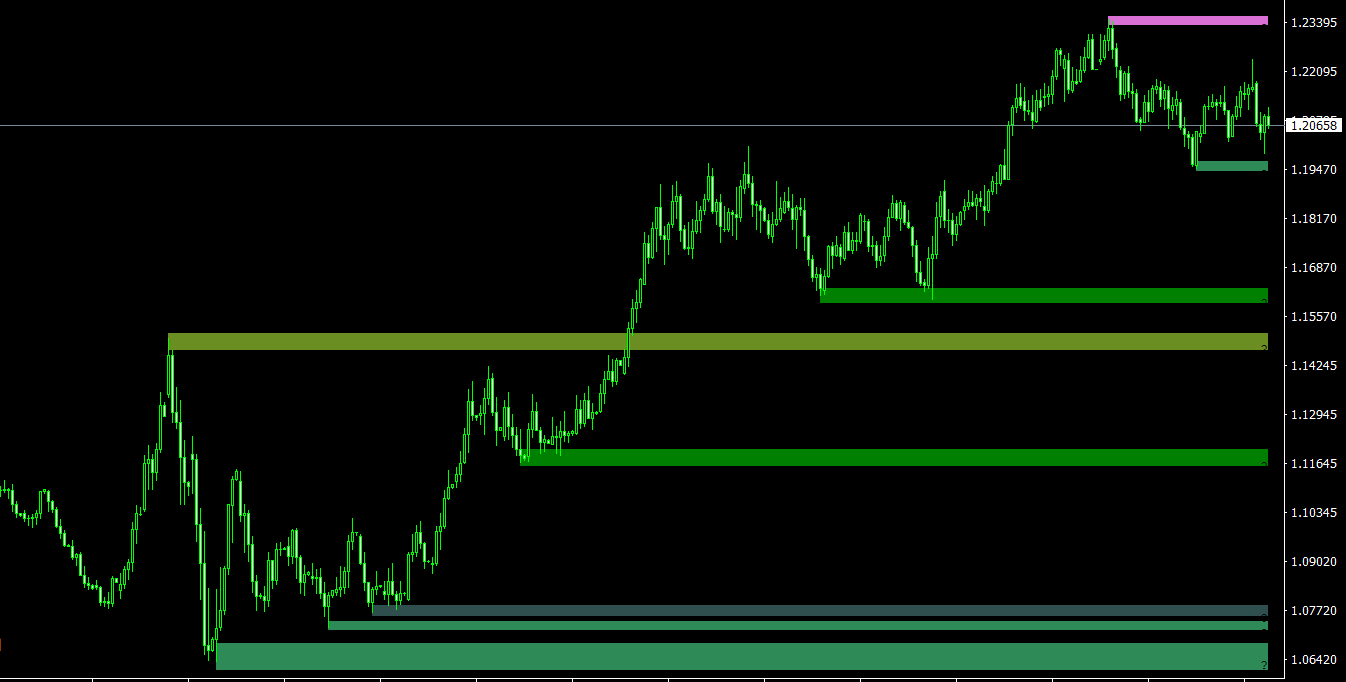
Channel indicators are a set of technical analysis tools that draw lines or channels on price charts to represent the price movement of a currency pair within a specified range. These channels help traders identify the trend direction, potential support and resistance levels, and market volatility, offering valuable insights into potential trading opportunities. Channel indicators can be used in both trending and range-bound markets, making them versatile tools in a trader’s arsenal.
Types of Channel Indicators
There are several types of channel indicators, each with its own unique characteristics and applications. Some of the most popular channel indicators include:
- Trend Channels: Trend channels, also known as price channels, are drawn by connecting the highs and lows of a currency pair’s price movement using parallel trendlines. The upper trendline connects the highs, while the lower trendline connects the lows, forming a channel that encapsulates the price action. Trend channels help traders identify the direction of the prevailing trend and potential entry and exit points based on support and resistance levels.
- Bollinger Bands: Developed by John Bollinger in the 1980s, Bollinger Bands are a volatility channel indicator that consists of three lines: a simple moving average (usually a 20-period SMA) and two standard deviations above and below the moving average. When the bands widen, it indicates increasing market volatility, while narrowing bands suggest decreasing volatility. Bollinger Bands can be used to identify potential overbought or oversold conditions, as well as potential entry and exit points based on price reversals.
- Keltner Channels: Keltner Channels, developed by Chester Keltner in the 1960s, are another volatility channel indicator. They consist of a centerline (usually an exponential moving average) and two lines above and below the centerline, calculated using the average true range (ATR). Like Bollinger Bands, Keltner Channels help traders identify market volatility and potential overbought or oversold conditions.
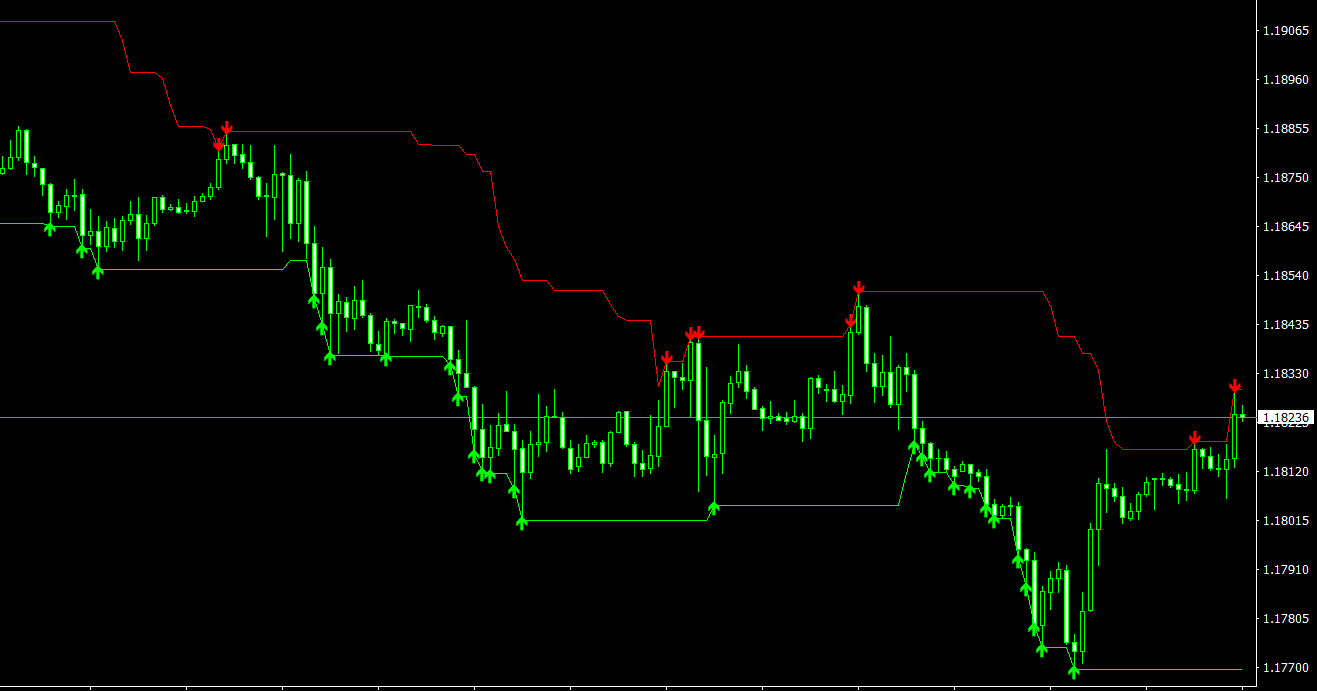
- Donchian Channels: Donchian Channels, created by Richard Donchian, are a trend-following channel indicator that consists of an upper and lower band based on the highest high and lowest low over a specified number of periods (usually 20 periods). Donchian Channels help traders identify potential breakouts and trend reversals, as well as establish stop-loss and profit target levels based on historical price extremes.
Using Channel Indicators in Forex Trading
To effectively use channel indicators in forex trading, consider the following tips:
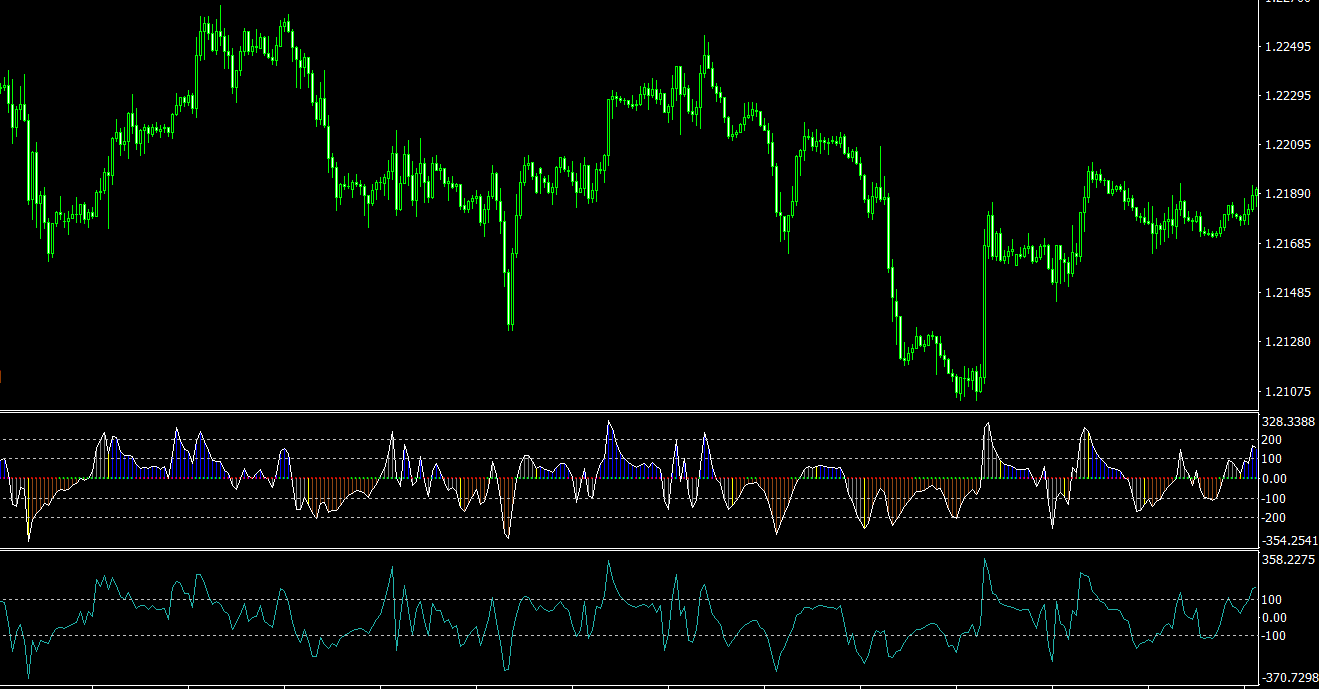
- Combine channel indicators with other technical analysis tools: Channel indicators, like any other technical analysis tool, should not be used in isolation. Combining them with other tools, such as oscillators, candlestick patterns, and other trend indicators, can provide additional confirmation and enhance the effectiveness of your analysis.
- Analyze multiple timeframes: Examining currency pairs on multiple timeframes can provide a more comprehensive view of the market and help you identify potential trading opportunities more effectively. For example, you can use a longer timeframe to determine the overall trend and a shorter timeframe to identify optimal entry and exit points.
- Be aware of false breakouts: Channels can occasionally produce false breakouts, where the price momentarily moves outside the channel but quickly reverses back within its boundaries. To mitigate the risk of false breakouts, look for additional confirmation from other technical analysis tools or wait for the price to close outside the channel before entering a trade.
- Implement sound risk management strategies: Despite the usefulness of channel indicators, forex trading always involves a degree of uncertainty. It’s essential to practice sound risk management strategies, such as setting stop-loss orders, managing your position sizes, and maintaining a diversified portfolio, to protect your capital and ensure long-term trading success.
- Test and optimize your trading strategy: Before incorporating channel indicators into your live trading, test your trading strategy using historical data or a demo account. This process allows you to assess the effectiveness of channel indicators and other technical analysis tools in your strategy and make any necessary adjustments to optimize performance.
Channel Trading Strategies
There are several ways to use channel indicators in forex trading. Some of the most popular strategies include:
- Trend Channel Breakout Trading: This strategy involves trading breakouts from trend channels, anticipating a potential trend continuation or reversal. When the price breaks above the upper trendline in an uptrend or below the lower trendline in a downtrend, traders can enter a position in the direction of the breakout, anticipating a continuation of the prevailing trend or a trend reversal. Stop-loss orders can be placed below or above the trendline, depending on the trade direction.
- Bollinger Band Squeeze Trading: This strategy involves identifying potential trading opportunities based on periods of low volatility, represented by the narrowing of Bollinger Bands. When the bands begin to widen after a period of contraction, traders can enter a position in the direction of the price breakout, anticipating an increase in market volatility and trend development. Stop-loss orders can be placed below or above the recent swing low or high, depending on the trade direction.
- Keltner Channel Reversal Trading: This strategy involves trading price reversals that occur when the price reaches the upper or lower Keltner Channel. When the price touches the upper channel and shows signs of reversal, such as a bearish candlestick pattern or an overbought oscillator reading, traders can enter a short position. Conversely, when the price touches the lower channel and exhibits reversal signals, traders can enter a long position. Stop-loss orders can be placed above or below the recent swing high or low, depending on the trade direction.
- Donchian Channel Breakout Trading: This strategy involves trading breakouts from Donchian Channels, with the expectation that the price will continue in the direction of the breakout. When the price breaks above the upper Donchian Channel, traders can enter a long position, while a break below the lower Donchian Channel warrants a short position. Stop-loss orders can be placed below or above the Donchian Channel, depending on the trade direction.
Conclusion
Channel indicators are a versatile and valuable set of technical analysis tools that can help forex traders identify trend direction, potential support and resistance levels, and market volatility. By understanding the concept of channel indicators, their various types, and how to use them effectively in conjunction with other technical analysis tools, traders can maximize their potential for success in the forex market.
Incorporating channel indicators into your forex trading strategy can provide valuable insights into price movements and market dynamics. By combining channel indicators with other technical analysis tools, analyzing multiple timeframes, and implementing sound risk management strategies, you can increase your chances of success in the highly competitive and ever-changing forex market.