In the world of forex trading, technical analysis plays an essential role in helping traders make informed decisions and develop successful trading strategies. Among the numerous technical analysis tools available, Fibonacci indicators are widely recognized for their ability to predict potential support and resistance levels and identify key market turning points. This article will discuss the concept of Fibonacci indicators, their applications, and how to use them effectively in forex trading.
What are Fibonacci Indicators?
Fibonacci indicators are a set of tools based on the mathematical principles of the Fibonacci sequence, a series of numbers discovered by the Italian mathematician Leonardo Fibonacci in the 13th century. The Fibonacci sequence is derived by adding the two preceding numbers to produce the next number in the series, starting with 0 and 1. The sequence looks like this: 0, 1, 1, 2, 3, 5, 8, 13, 21, and so on.
The key characteristic of the Fibonacci sequence is the occurrence of specific ratios between consecutive numbers. As the sequence progresses, the ratio of any number to its next higher number approaches 0.618, known as the Golden Ratio or Phi. The inverse of the Golden Ratio is approximately 1.618. Other significant ratios derived from the Fibonacci sequence include 0.382 and 0.236.
Fibonacci indicators apply these ratios to financial markets to predict potential support and resistance levels, as well as key market turning points. The most popular Fibonacci indicators include Fibonacci retracements, Fibonacci extensions, and Fibonacci arcs.
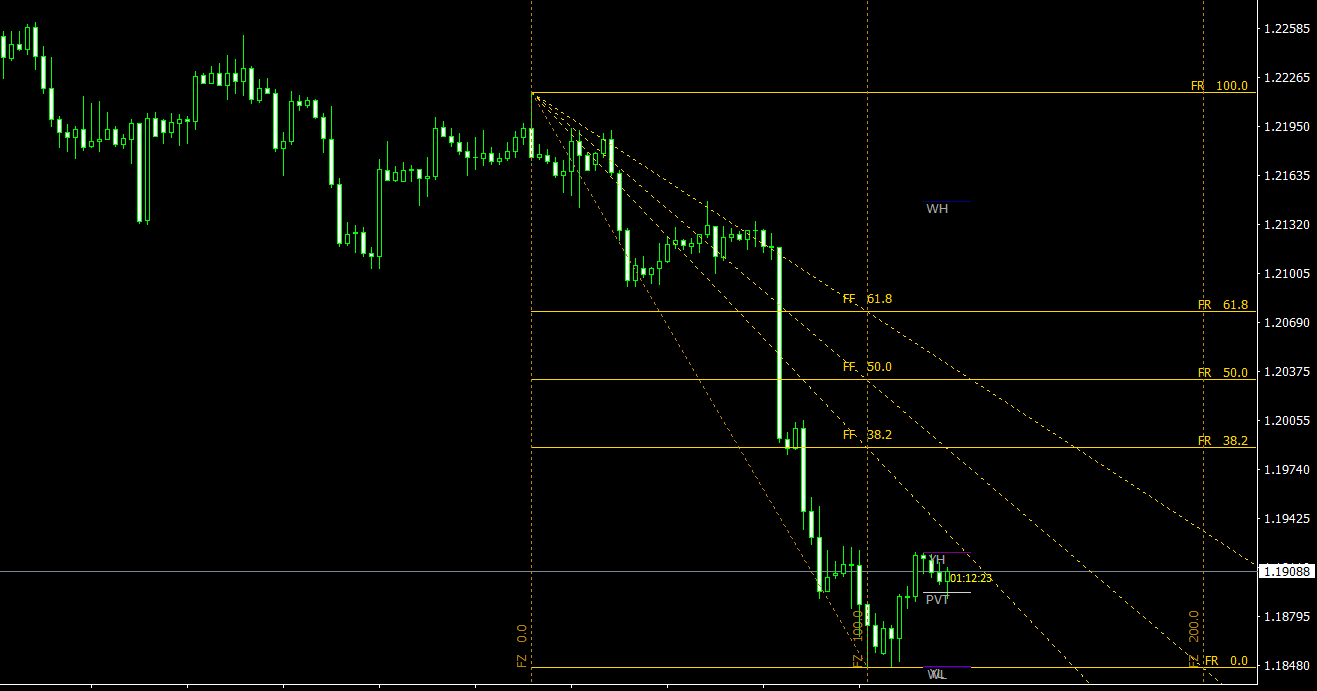
- Fibonacci Retracements: Fibonacci retracements are horizontal lines drawn on a chart to indicate potential support and resistance levels based on the Fibonacci ratios. These levels are calculated by taking the vertical distance between a significant high and low point on the chart and dividing it by the key Fibonacci ratios (23.6%, 38.2%, 50%, 61.8%, and 78.6%).
- Fibonacci Extensions: Fibonacci extensions, also known as Fibonacci projections, are used to predict potential price targets following a retracement. These levels are calculated by taking the vertical distance between a significant high and low point and multiplying it by the key Fibonacci ratios, then projecting these levels from the end of the retracement.
- Fibonacci Arcs: Fibonacci arcs are curved lines drawn on a chart to indicate potential support and resistance levels based on the Fibonacci ratios. These arcs are created by drawing a trendline between a significant high and low point, and then dividing the trendline by the key Fibonacci ratios.
Using Fibonacci Indicators in Forex Trading
To effectively use Fibonacci indicators in forex trading, consider the following tips:
- Identify significant high and low points: The accuracy of Fibonacci indicators heavily depends on the identification of significant high and low points in the market. These points should represent major price reversals or turning points in the market, and can be identified by analyzing historical price data and chart patterns.
- Combine Fibonacci indicators with other technical analysis tools: Fibonacci indicators, like any other technical analysis tool, should not be used in isolation. Combining them with other tools, such as support and resistance levels, trend lines, moving averages, and oscillators, can provide additional confirmation and enhance the effectiveness of your analysis.
- Analyze multiple timeframes: Examining currency pairs on multiple timeframes can provide a more comprehensive view of the market and help you identify potential trading opportunities more effectively. For example, you can use a longer timeframe to determine the overall trend and a shorter timeframe to identify optimal entry and exit points.
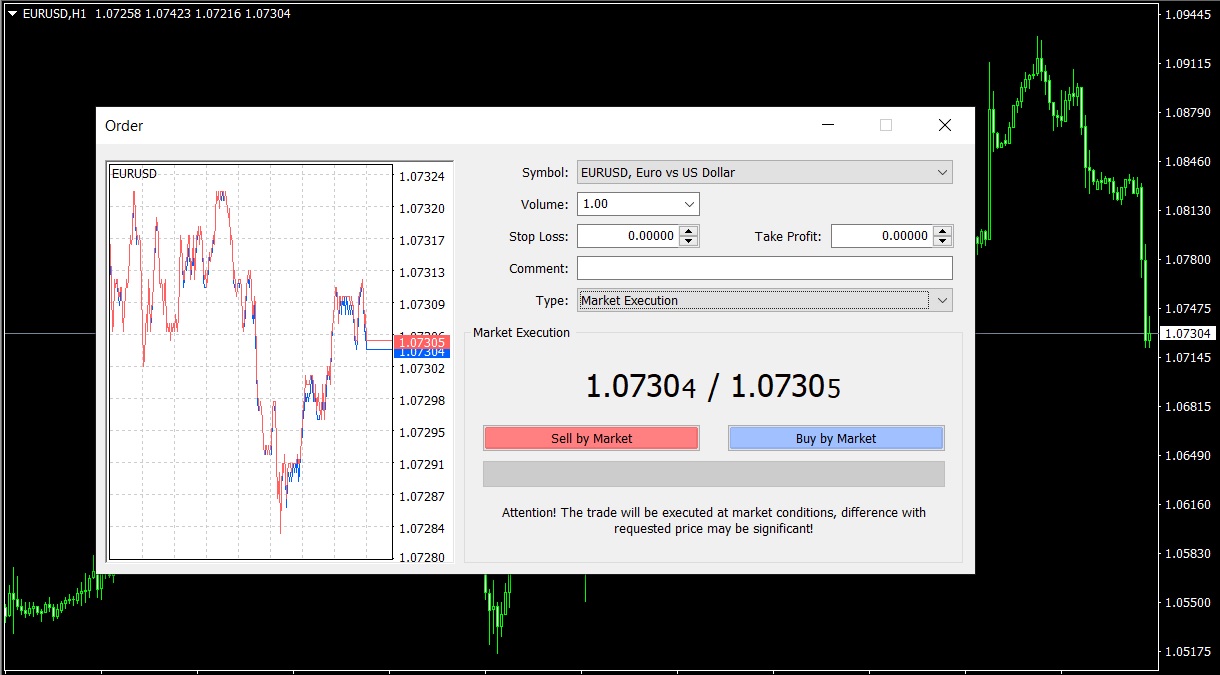
- Implement sound risk management strategies: Despite the usefulness of Fibonacci indicators, forex trading always involves a degree of uncertainty. It’s essential to practice sound risk management strategies, such as setting stop-loss orders, managing your position sizes, and maintaining a diversified portfolio, to protect your capital and ensure long-term trading success.
- Test and optimize your trading strategy: Before incorporating Fibonacci indicators into your live trading, test your trading strategy using historical data or a demo account. This process allows you to assess the effectiveness of Fibonacci indicators and other technical analysis tools in your strategy, and make any necessary adjustments to optimize performance.
Fibonacci Trading Strategies
There are several ways to use Fibonacci indicators in forex trading. Some of the most popular strategies include:
- Fibonacci Retracement Trading: This strategy involves identifying potential entry and exit points based on Fibonacci retracement levels. When the price retraces to a significant Fibonacci level and shows signs of reversal, such as a candlestick pattern or a reversal signal from an oscillator, traders can enter a position in the direction of the overall trend. Stop-loss orders can be placed below or above the retracement level, depending on the trade direction.
- Fibonacci Extension Trading: This strategy involves using Fibonacci extension levels to set profit targets after a retracement. Traders can enter a position in the direction of the overall trend once the retracement is complete, and set profit targets at one or more Fibonacci extension levels. Stop-loss orders can be placed below or above the retracement level or the recent swing high or low, depending on the trade direction.
- Fibonacci Confluence Trading: This strategy involves combining multiple Fibonacci indicators and other technical analysis tools to identify areas of confluence or agreement between different indicators. For example, a trader may identify a significant support or resistance level that aligns with a Fibonacci retracement or extension level, or a trendline that intersects with a Fibonacci arc. These confluence areas may provide high-probability trading opportunities, as they represent a stronger agreement between various market factors.
Conclusion
Fibonacci indicators are a powerful and widely recognized set of technical analysis tools that can help forex traders predict potential support and resistance levels, as well as key market turning points. By understanding the concept of Fibonacci indicators, their applications, and how to use them effectively in conjunction with other technical analysis tools, traders can maximize their potential for success in the forex market.
Incorporating Fibonacci indicators into your forex trading strategy can provide valuable insights into potential price targets and market turning points. By combining Fibonacci indicators with other technical analysis tools, analyzing multiple timeframes, and implementing sound risk management strategies, you can increase your chances of success in the highly competitive and ever-changing forex market.