Forex trading is a vast field, where several techniques and strategies are used by traders to maximize their profits. One such popular and widely used tool in technical analysis is the Forex Fibonacci retracement. This article aims to provide a comprehensive understanding of the Forex Fibonacci retracement, its origins, how it works, and practical tips for implementing it in your trading strategy.
Origins of the Fibonacci Retracement
The Fibonacci retracement is based on the Fibonacci sequence, a series of numbers discovered by Italian mathematician Leonardo Fibonacci in the 13th century. In this sequence, each number is the sum of the two preceding ones, starting from 0 and 1. The sequence goes: 0, 1, 1, 2, 3, 5, 8, 13, 21, 34, and so on. Fibonacci numbers have unique mathematical properties and can be found in various aspects of nature, such as the arrangement of leaves on a stem, the branching of trees, and the spirals of shells.
The Golden Ratio and Forex Trading
The Fibonacci sequence is closely related to the Golden Ratio, which is approximately 1.618. The Golden Ratio is obtained by dividing a Fibonacci number by its immediate predecessor in the sequence. As the sequence progresses, the ratio between adjacent numbers approaches the Golden Ratio. This ratio is considered aesthetically pleasing and can be found in architecture, art, and nature.
In Forex trading, the Golden Ratio is used to determine potential retracement levels in price trends. These levels are calculated as percentages of the Golden Ratio and its inverse (0.618 and 1.618). The most common Fibonacci retracement levels are 23.6%, 38.2%, 50%, 61.8%, and 78.6%.
Understanding Forex Fibonacci Retracement
A Forex Fibonacci retracement is a technical analysis tool used by traders to identify potential support and resistance levels during a price trend. These levels represent the points at which a price movement may reverse or stall, providing traders with potential entry or exit points for their trades.
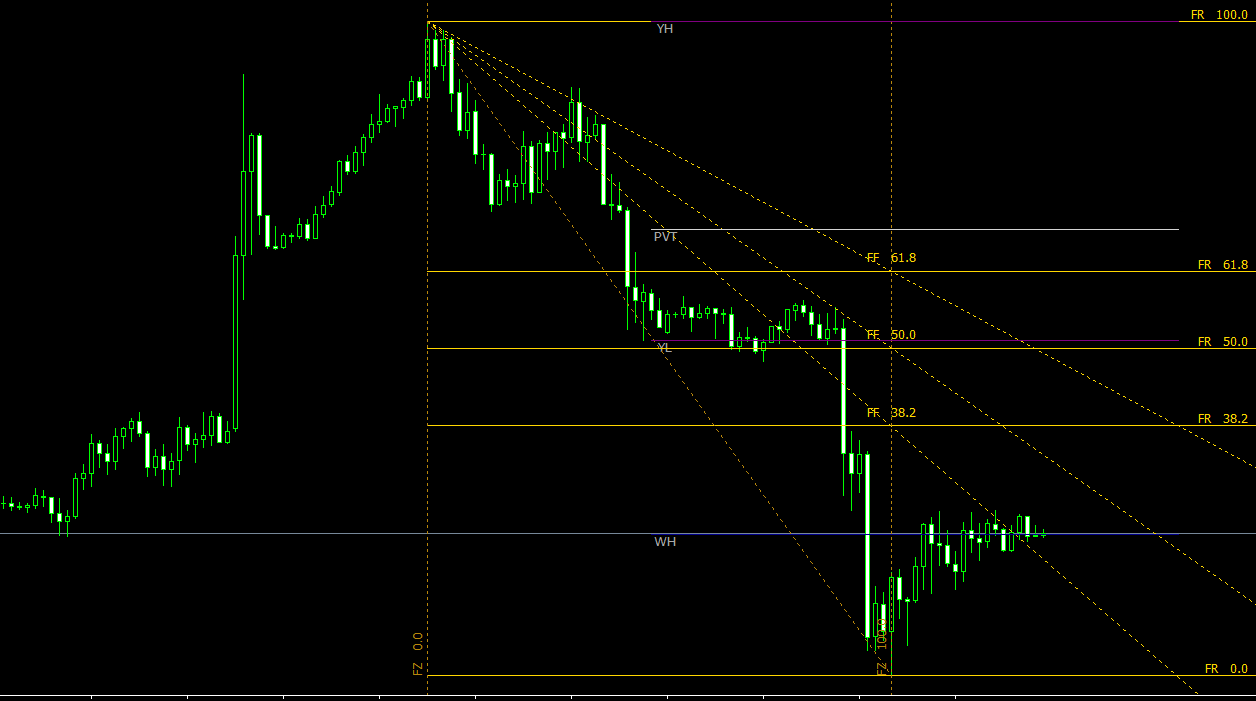
The retracement levels are calculated by measuring the distance between a significant price high (swing high) and a significant price low (swing low), and then multiplying this distance by the Fibonacci ratios mentioned earlier. These levels are then plotted on a chart, creating horizontal lines that can be used to predict potential price reversals.
How to Use Forex Fibonacci Retracements
- Identifying Swing Highs and Swing Lows: To apply Fibonacci retracement levels to your chart, you need to identify significant price highs and lows. These points represent the starting and ending points of a price movement.
- Applying the Fibonacci Retracement Tool: Most trading platforms have a built-in Fibonacci retracement tool. Select this tool and click on the swing low, then drag the cursor to the swing high, and release it. The retracement levels will be automatically plotted on your chart.
- Analyzing Retracement Levels: Look for potential reversal points or areas of consolidation near the Fibonacci retracement levels. These levels may act as support or resistance, where price may stall or change direction. When multiple retracement levels converge, they form a stronger support or resistance zone, increasing the likelihood of a price reversal.
- Incorporating Other Technical Indicators: For better accuracy and confirmation of potential reversals, use Fibonacci retracements in conjunction with other technical analysis tools, such as moving averages, trend lines, candlestick patterns, or oscillators like the Relative Strength Index (RSI) and Stochastic.
- Risk Management and Trading Strategy: Implement proper risk management techniques, such as setting stop-loss orders and position sizing, when trading with Fibonacci retracements. It is essential to have a well-defined trading strategy that outlines entry and exit points, as well as profit targets, to ensure disciplined trading.
Practical Tips for Using Forex Fibonacci Retracements
- Be Patient: Wait for confirmation of a potential price reversal, such as a candlestick pattern or a break of a trend line, before entering a trade based on Fibonacci retracement levels.
- Stay Flexible: Fibonacci retracements are not foolproof, and price may not always reverse exactly at these levels. Be prepared for slight variations and consider using other technical indicators for added confirmation.
- Use Higher Timeframes: Fibonacci retracements tend to be more reliable on higher timeframes, such as the 4-hour, daily, or weekly charts. These timeframes may provide a clearer view of the overall trend and significant support and resistance levels.
- Practice and Learn: As with any trading technique, practice is crucial for mastering the use of Fibonacci retracements. Start with a demo account, study historical price data, and analyze the effectiveness of retracement levels in various market conditions.
Conclusion
Forex Fibonacci retracement is a valuable tool in technical analysis, helping traders identify potential reversal points in price trends. By understanding the origins of the Fibonacci sequence and the Golden Ratio, and applying these principles to Forex trading, you can enhance your trading strategy and improve your chances of success. Remember to be patient, use proper risk management, and practice your skills to effectively incorporate Fibonacci retracements into your trading.