The world of forex trading offers a plethora of tools and indicators to help traders navigate the complex landscape of currency markets. One of these tools is the Donchian Channel, which can provide valuable insights into market trends and potential trading opportunities. In this article, we will delve into the concept of the Donchian Channel, its utility in forex trading, and provide examples of when to open and close buy and sell trades using this versatile indicator.
What is a Forex Donchian Channel?
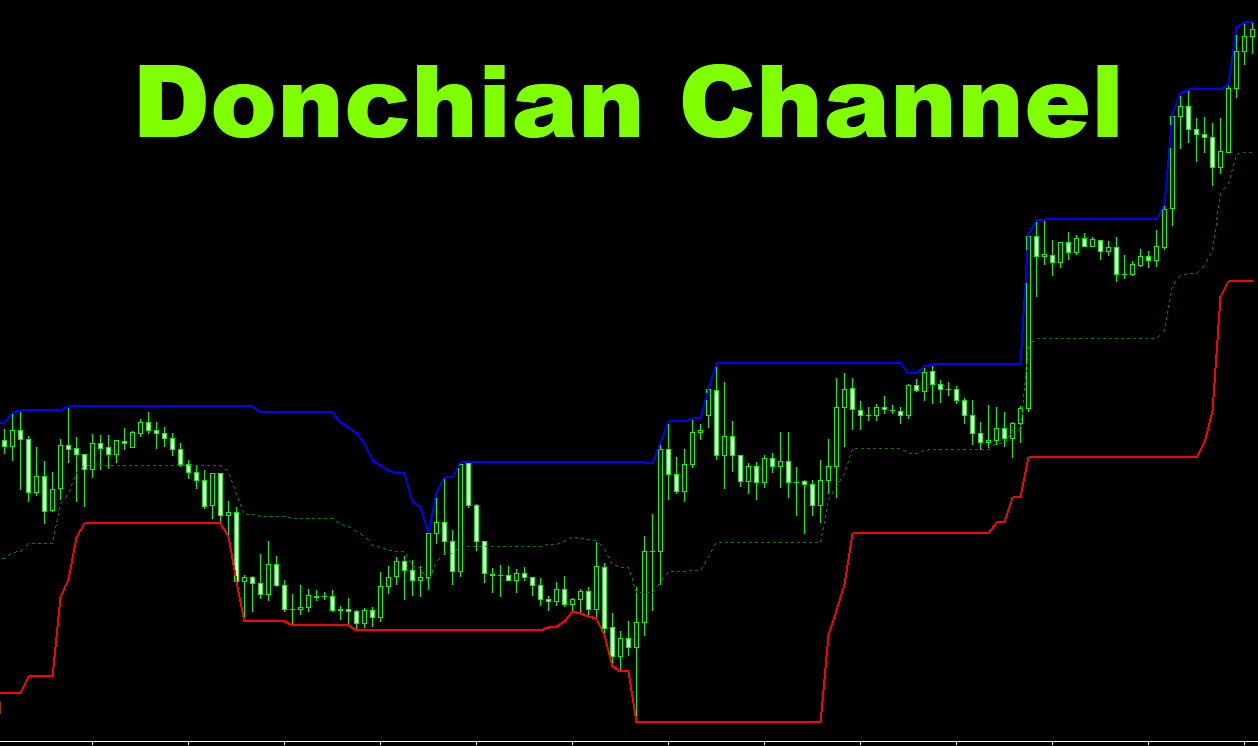
The Donchian Channel is a technical analysis indicator developed by Richard Donchian, a pioneer in the field of trend-following systems. The Donchian Channel is a price channel that consists of an upper and lower band, which are calculated based on the highest high and lowest low prices over a specified period. The channel is designed to help traders identify market trends and potential breakouts or reversals.
If you are trading on Metatrader4 platform and would like to use Donchian Channel, you may download VR Donchian Lite MT4 indicator and put it on your chart.
The Donchian Channel is calculated as follows:
Upper Band = Highest High over a specified period Lower Band = Lowest Low over a specified period Middle Line (optional) = (Upper Band + Lower Band) / 2
The specified period is generally 20 trading days for daily charts, although traders can adjust the period according to their preferred timeframes and trading strategies.
Using the Donchian Channel in Forex Trading: Practical Examples
The Donchian Channel can be a valuable tool in forex trading, helping traders identify market trends, potential breakouts, and entry and exit points. The channel essentially serves as a visual representation of support and resistance levels, with the upper band acting as resistance and the lower band as support. When the price of a currency pair is trading within the channel, it indicates a range-bound market, while a breakout above or below the channel suggests the potential for a new trend or trend reversal.
To effectively use the Donchian Channel in forex trading, it is crucial to understand how it can generate buy and sell signals. Here are some practical examples:
- Breakout Trading
When the price of a currency pair breaks above the upper band of the Donchian Channel, it signals a potential uptrend, indicating a potential buying opportunity. Conversely, when the price breaks below the lower band, it suggests a potential downtrend, which may be an ideal time to sell.
Example: A trader observes that the price of the EUR/USD pair has broken above the upper band of the Donchian Channel, signaling a potential uptrend. The trader decides to open a buy position, expecting the price to continue rising. As anticipated, the price of the EUR/USD pair increases, allowing the trader to close their buy position at a profit.
- Trend Reversal Trading
Traders can also use the Donchian Channel to identify potential trend reversals. When the price of a currency pair approaches the upper or lower band and then reverses direction, it may indicate a trend reversal.
Example: A trader notices that the price of the GBP/USD pair is approaching the upper band of the Donchian Channel but fails to break above it. Instead, the price begins to decline, suggesting a potential trend reversal. The trader decides to open a sell position, expecting the price to continue falling. The price of the GBP/USD pair decreases as anticipated, and the trader closes their sell position at a profit.
- Stop Loss and Take Profit Placement
The Donchian Channel can also help traders set stop loss and take profit levels. For long positions, traders can place their stop loss below the lower band of the channel, while short positions can have a stop loss above the upper band. Similarly, take profit levels can be set near the opposite band of the channel for both long and short positions, providing traders with a clear target for exiting the trade.
Example: A trader enters a buy position on the USD/JPY pair after the price breaks above the upper band of the Donchian Channel, signaling a potential uptrend. The trader sets a stop loss below the lower band to limit potential losses and a take profit near the upper band to capture profits if the price reaches that level. As the price of the USD/JPY pair continues to rise, it eventually hits the take profit level, and the trader closes their buy position at a profit.
- Channel Trading
When the price of a currency pair is trading within the Donchian Channel without breaking above or below the bands, it indicates a range-bound market. In this scenario, traders can use the channel to identify potential trading opportunities by buying near the lower band and selling near the upper band.
Example: A trader observes that the AUD/USD pair is trading within the Donchian Channel, indicating a range-bound market. The trader decides to buy the pair near the lower band, expecting the price to rebound towards the upper band. As the price approaches the upper band, the trader closes their buy position at a profit, capturing the gains from the range-bound movement.
Conclusion
The Donchian Channel is a versatile and valuable technical analysis tool in forex trading, providing traders with insights into market trends, potential breakouts, and entry and exit points. By understanding how to apply the Donchian Channel to generate buy and sell signals, traders can make more informed decisions and capitalize on market opportunities. However, it is essential to remember that no single indicator can guarantee success in the market. Combining the Donchian Channel with other technical indicators and a solid risk management strategy can help traders create a more comprehensive and effective trading approach.