The foreign exchange market, or forex, presents various indicators that traders can employ to gauge market trends and make well-informed trading decisions. The RSI HistoAlert V2 is a powerful custom indicator for the MetaTrader 4 trading platform, providing valuable insights through the use of an RSI histogram and a smoothing moving average. This article will explain the RSI HistoAlert V2 indicator in detail, how it functions, and how traders can use it to enhance their forex trading strategies.
What is the RSI HistoAlert V2 Indicator?
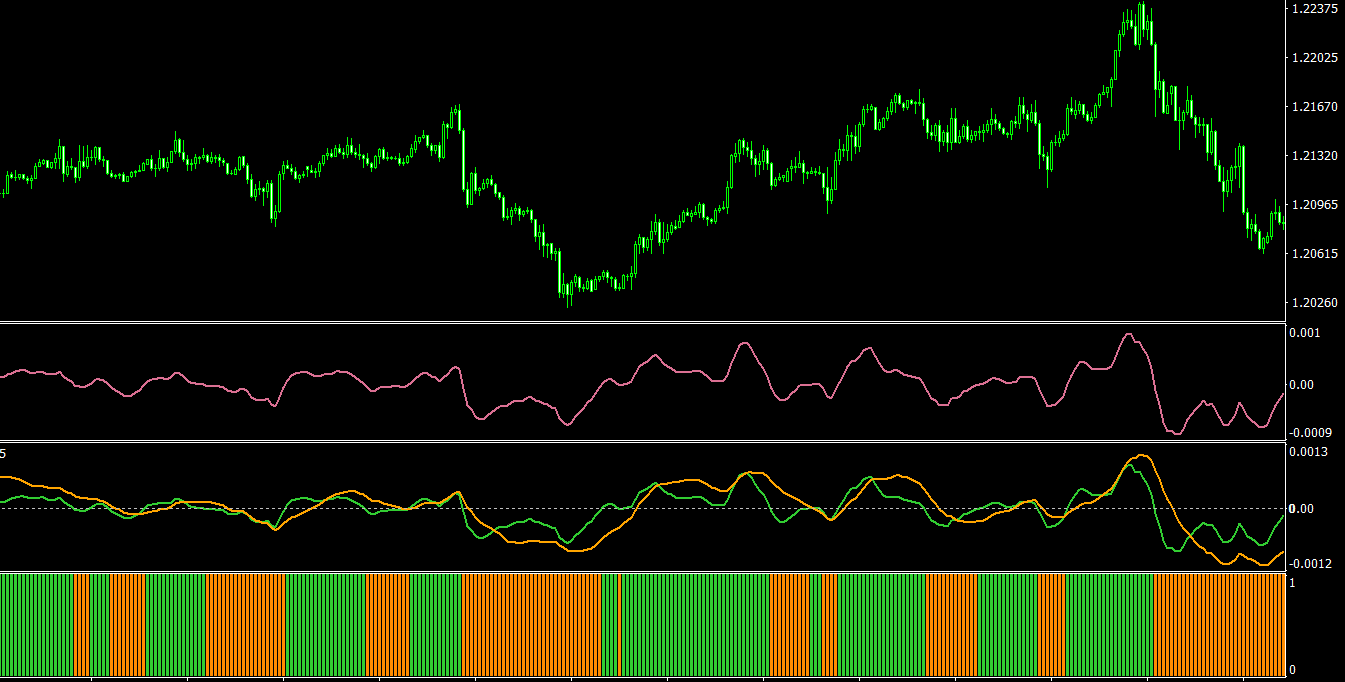
The RSI HistoAlert V2 is a custom indicator for the MetaTrader 4 platform that combines the principles of the Relative Strength Index (RSI) with a histogram representation. This indicator is designed to help traders easily visualize market trends and momentum by plotting an RSI histogram on a chart. The green bars in the histogram indicate an uptrend, while the red bars signify a downtrend.
A unique feature of the RSI HistoAlert V2 indicator is its incorporation of a smoothing moving average, which acts as a signal line, similar to the MACD indicator. This smoothing moving average provides an additional layer of information for traders, helping them identify potential entry and exit points in the market.
How the RSI HistoAlert V2 Indicator Works
The RSI HistoAlert V2 MT4 indicator calculates the RSI value for a specified period and represents it in the form of a histogram. The green and red bars in the histogram indicate the momentum of the market, with green bars representing a bullish momentum and red bars a bearish momentum.
The smoothing moving average, or signal line, is calculated by averaging the RSI histogram values over a specific period. This line provides a clear visual representation of the overall trend, helping traders quickly identify whether the market is in an uptrend or downtrend. When the histogram bars are above the signal line, it indicates a bullish market, and when they are below the signal line, it suggests a bearish market.
Using the RSI HistoAlert V2 Indicator in Forex Trading
To effectively use the RSI HistoAlert V2 indicator in forex trading, traders need to understand how it generates buy and sell signals. Here are some practical examples:
- Histogram and Signal Line Crossovers
When the RSI histogram crosses above the signal line, it indicates a potential buying opportunity, as the market is gaining bullish momentum. Conversely, when the histogram crosses below the signal line, it suggests a selling opportunity, as the market is exhibiting bearish momentum.
- Overbought and Oversold Conditions
The RSI HistoAlert V2 MT4 indicator can also help traders identify overbought and oversold conditions in the market. When the RSI histogram reaches a high level (typically above +40), it suggests that the market is overbought and may soon experience a price reversal. On the other hand, when the histogram reaches a low level (usually below -40), it indicates that the market is oversold, and a price reversal may be imminent.
- Divergence Trading
Traders can also use the RSI HistoAlert V2 indicator to identify divergence between the price action and the RSI histogram, signaling potential trend reversals or a loss of momentum. This can offer entry or exit points for traders.
Bullish Divergence: A bullish divergence occurs when the price of a currency pair forms a lower low, while the RSI histogram forms a higher low. This indicates that the downtrend may be losing strength, and a reversal might be on the horizon. In this scenario, traders can consider opening a buy position, anticipating an increase in price.
Bearish Divergence: A bearish divergence happens when the price of a currency pair forms a higher high, while the RSI histogram forms a lower high. This suggests that the uptrend could be weakening, and a price reversal may soon follow. Traders can capitalize on this by opening a sell position, expecting the price to decrease.
Conclusion
The RSI HistoAlert V2 indicator is a valuable addition to a forex trader’s arsenal, providing valuable insights into market trends, momentum, and potential trading opportunities. By understanding how to apply the RSI HistoAlert V2 indicator to generate buy and sell signals, traders can capitalize on market opportunities and make more informed trading decisions. However, it is crucial to remember that no single indicator can provide a complete picture of the market. Combining the RSI HistoAlert V2 with other technical indicators and a solid risk management strategy can help traders create a more comprehensive and effective trading approach.
Features of RSI HistoAlert V2 MT4 indicator
- Platform: Metatrader 4
- Ability to change settings: Yes
- Timeframe: any from 1 Minute to Daily
- Currency pairs: any
In RSI-HistoAlert-v2.zip file you will find:
- RSI HistoAlert v2.ex4
Download RSI HistoAlert V2 MT4 indicator for free: