In the realm of forex trading, technical analysis is a crucial component that helps traders make informed decisions and develop effective trading strategies. Among the myriad of technical analysis tools available, momentum indicators are particularly useful for gauging the strength of price movements and identifying potential trend reversals. This article will discuss the concept of momentum indicators, explore some popular examples, and provide guidance on using them effectively in forex trading.
What are Momentum Indicators?
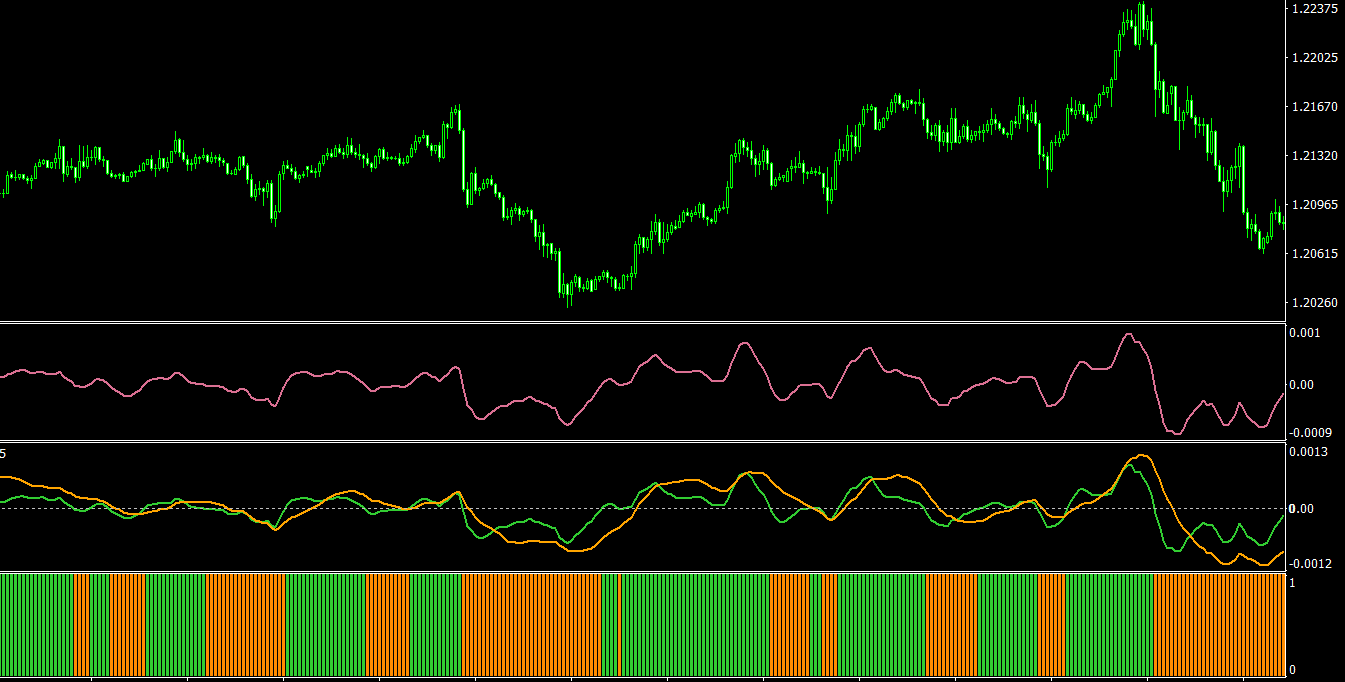
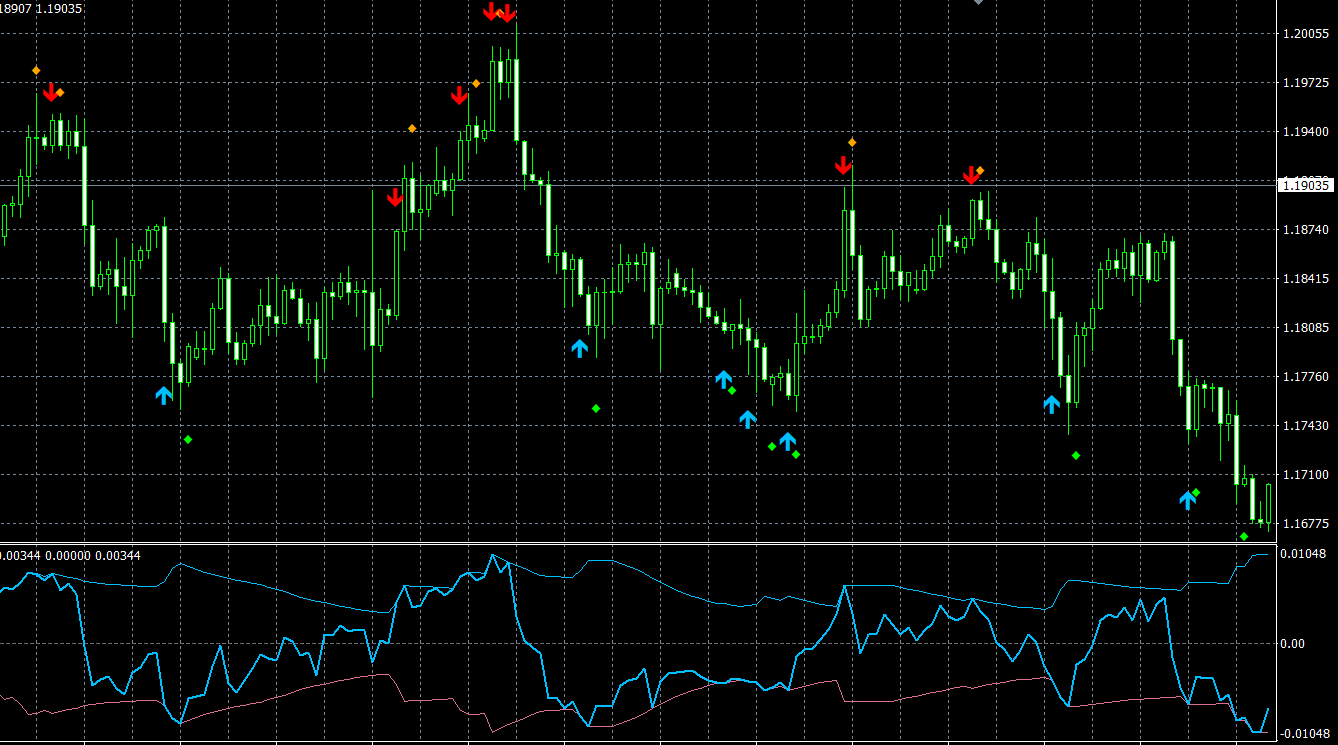
Momentum indicators, also known as oscillators, are a group of technical analysis tools that measure the rate of change in the price of a currency pair. By evaluating the speed and magnitude of price fluctuations, these indicators provide insights into the market’s strength and direction, allowing traders to identify potential trading opportunities, overbought and oversold conditions, and trend reversals.
Some Popular Momentum Indicators
There are several momentum indicators commonly used in forex trading, each with its unique characteristics and calculation methods. Some of the most popular momentum indicators include:
- Relative Strength Index (RSI)
The Relative Strength Index (RSI), developed by J. Welles Wilder, is a momentum oscillator that measures the speed and change of price movements. Ranging between 0 and 100, the RSI calculates the ratio of average gains to average losses over a specified period, typically 14 periods. A high RSI value (above 70) indicates overbought conditions, while a low RSI value (below 30) suggests oversold conditions.
- Moving Average Convergence Divergence (MACD)
The Moving Average Convergence Divergence (MACD) is a momentum indicator that reveals the relationship between two moving averages of a currency pair’s price. The MACD is calculated by subtracting the 26-period Exponential Moving Average (EMA) from the 12-period EMA. A signal line, typically the 9-period EMA of the MACD, is also plotted alongside the MACD to generate buy and sell signals.
- Stochastic Oscillator
The Stochastic Oscillator, developed by George C. Lane, is a momentum indicator that compares a currency pair’s closing price to its price range over a specified period. The Stochastic Oscillator consists of two lines, %K and %D, which oscillate between 0 and 100. Similar to the RSI, the Stochastic Oscillator identifies overbought and oversold conditions, with values above 80 indicating overbought conditions and values below 20 suggesting oversold conditions.
- Commodity Channel Index (CCI)
The Commodity Channel Index (CCI), created by Donald Lambert, is a momentum-based oscillator that measures the deviation of a currency pair’s price from its statistical mean. The CCI oscillates above and below a zero line, with positive values indicating upward momentum and negative values signaling downward momentum. By setting overbought and oversold thresholds, traders can identify potential reversals and new trading opportunities.
Using Momentum Indicators in Forex Trading
To effectively use momentum indicators in forex trading, consider the following tips:
- Choose the appropriate momentum indicator(s): Select the indicator(s) that best align with your trading strategy and the market conditions. It’s essential to understand the strengths and limitations of each indicator to maximize their effectiveness.
- Combine momentum indicators with other technical analysis tools: While momentum indicators can be powerful on their own, combining them with other technical analysis tools, such as support and resistance levels, chart patterns, and trend lines, can provide additional confirmation and enhance their effectiveness.
- Analyze multiple timeframes: Examining currency pairs on multiple timeframes can provide a more comprehensive view of the market and help you identify potential trading opportunities more effectively. For example, you may use a longer timeframe to determine the overall trend and a shorter timeframe to identify optimal entry and exit points.
- Monitor divergences: Divergences occur when the price and momentum indicator move in opposite directions, signaling a potential trend reversal. For instance, if the price is making higher highs, but the momentum indicator is making lower highs, this could indicate weakening upward momentum and a potential bearish reversal.
- Set appropriate overbought and oversold levels: Each momentum indicator may have different overbought and oversold thresholds. Familiarize yourself with these levels for the indicators you’re using, and adjust them as necessary to match the market’s volatility and your trading strategy.
- Implement sound risk management strategies: Despite the usefulness of momentum indicators, forex trading always involves a degree of uncertainty. It’s essential to practice sound risk management strategies, such as setting stop-loss orders, managing your position sizes, and maintaining a diversified portfolio, to protect your capital and ensure long-term trading success.
- Test and optimize your trading strategy: Before incorporating momentum indicators into your live trading, test your trading strategy using historical data or a demo account. This process allows you to assess the effectiveness of momentum indicators and other technical analysis tools in your strategy, and make any necessary adjustments to optimize performance.
Conclusion
Momentum indicators are valuable tools that can help forex traders gauge the strength and direction of price movements, identify potential trend reversals, and uncover new trading opportunities. By understanding the various types of momentum indicators, their calculations, and how to effectively use them in conjunction with other technical analysis tools, traders can maximize their potential for success in the forex market.


