Foreign exchange trading, commonly known as forex, is the largest financial market in the world. It involves the buying and selling of currencies in a highly liquid and fast-paced environment. Among the plethora of trading strategies and indicators available to traders, the Ichimoku Cloud is a particularly intriguing and multi-faceted tool. In this article, we will explain the mechanics of the Ichimoku Cloud and understand how traders can utilize it to make informed decisions in the forex market.
A Brief Introduction to the Ichimoku Cloud
Developed by a Japanese journalist named Goichi Hosoda in the late 1960s, the Ichimoku Cloud, also known as Ichimoku Kinko Hyo (which translates to “one glance equilibrium chart”), is a technical analysis tool that provides a comprehensive overview of an asset’s price movement. While it is now widely used across various financial markets, it is particularly popular in forex trading.
The Ichimoku Cloud is designed to help traders identify trends, gauge momentum, and find potential levels of support and resistance. What sets it apart is its ability to provide a wealth of information through a single glance, which can be invaluable in the fast-moving world of forex trading.
The Components of the Ichimoku Cloud
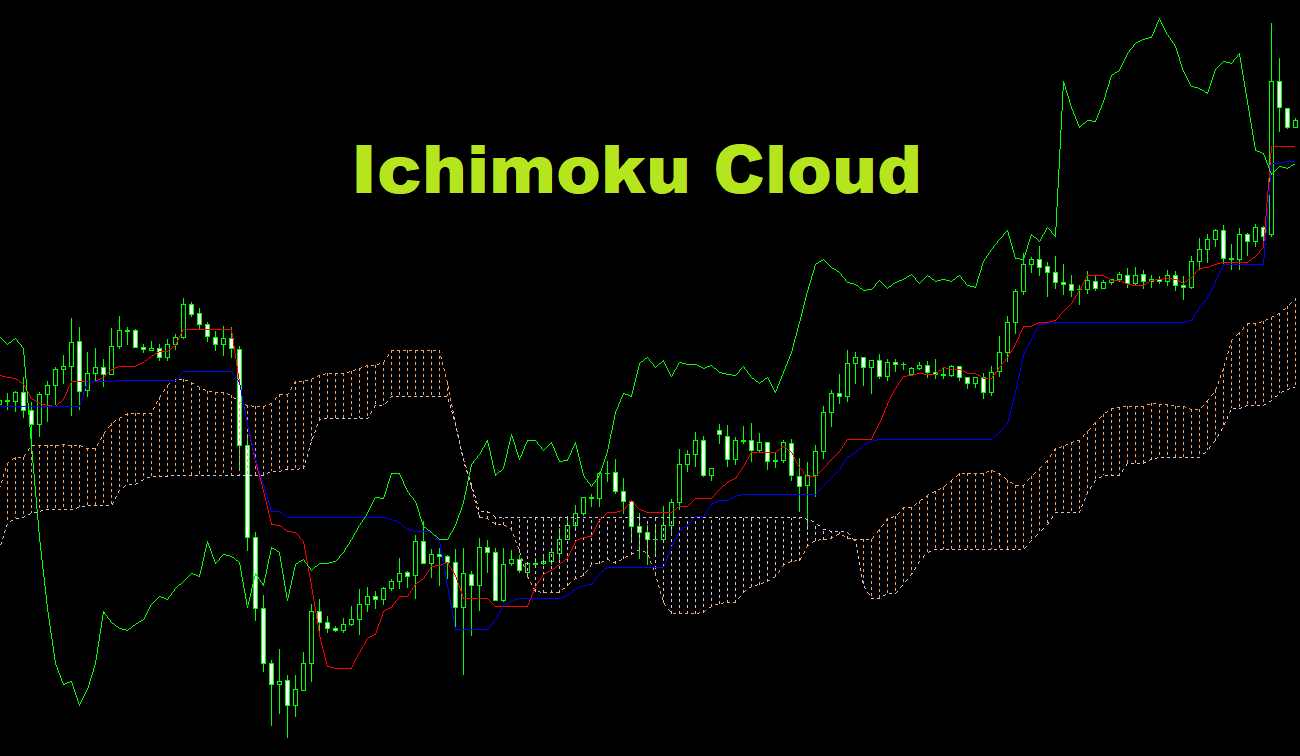
The Ichimoku Cloud is comprised of five lines, each providing different insights into the market. These lines are plotted on the price chart and together form the ‘cloud’:
- Tenkan-sen (Conversion Line. Red line on the chart): It is calculated by averaging the highest high and the lowest low over the last 9 periods. This line is an indicator of the market’s equilibrium and can be thought of as a trigger line for signals.
- Kijun-sen (Base Line. Blue line): This line averages the highest high and the lowest low over the last 26 periods. It is used to signal a change in market momentum. When the price is above the Kijun-sen, it suggests an upward momentum, and vice versa.
- Senkou Span A (Leading Span A): Calculated by averaging the Tenkan-sen and Kijun-sen, and then plotted 26 periods ahead. It forms one of the edges of the Ichimoku Cloud.
- Senkou Span B (Leading Span B): This line averages the highest high and the lowest low over the last 52 periods, and is plotted 26 periods into the future. It forms the other edge of the Ichimoku Cloud.
- Chikou Span (Lagging Span. Green line): It is the current period’s closing price plotted 26 periods behind. The position of the Chikou Span relative to the price reflects the market sentiment.
The space between Senkou Span A and Senkou Span B forms the actual ‘cloud’. When the Senkou Span A is above the Senkou Span B, the cloud is typically shaded green (but brown on MT4), indicating a bullish trend. Conversely, when the Senkou Span A is below the Senkou Span B, the cloud is shaded red (but pink on MT4), indicating a bearish trend.
Using the Ichimoku Cloud in Forex Trading
Identifying Trends
One of the primary uses of the Ichimoku Cloud is to identify the prevailing trend. If the price is above the cloud, this is an indication of a bullish trend. If it is below the cloud, this indicates a bearish trend. When the price is within the cloud, the market is considered to be in a consolidation phase, and traders may wait for a breakout in either direction.
Gauging Momentum
The relationship between the Tenkan-sen and Kijun-sen can be used to gauge the market’s momentum. When the Tenkan-sen is above the Kijun-sen, it indicates bullish momentum, and when it’s below, it suggests bearish momentum. A crossover of these lines can be a signal for potential entry or exit points.
Support and Resistance
The cloud itself can act as an area of support or resistance. In a bullish trend, the cloud often serves as support, whereas in a bearish trend, it can act as resistance. Traders can use this information to set stop-loss orders or to identify potential reversal points.
Trading Signals
The Ichimoku Cloud provides various trading signals:
- Tenkan-sen/Kijun-sen Cross: This is one of the most significant signals. A bullish signal is given when the Tenkan-sen crosses above the Kijun-sen, and a bearish signal when it crosses below.
- Price/Cross Cloud Cross: When the price crosses the cloud, it can indicate a trend change. If the price moves from below to above the cloud, it’s a bullish signal. Conversely, if it moves from above to below, it’s a bearish signal.
- Chikou Span Confirmation: The Chikou Span can be used to confirm other signals. For instance, in a bullish Tenkan-sen/Kijun-sen cross, if the Chikou Span is above the price 26 periods ago, it strengthens the bullish signal.
Understanding Limitations and Best Practices
As with any technical analysis tool, the Ichimoku Cloud is not foolproof and should not be used in isolation. It’s essential to understand its limitations. For example, in a sideways market, the Ichimoku Cloud might produce many false signals. Additionally, the settings of 9, 26, and 52 periods are based on the Japanese trading week and may not be optimal for all trading styles and timeframes.
Here are some best practices for using the Ichimoku Cloud in forex trading:
- Combine with Other MT4 Indicators: Combining the Ichimoku Cloud with other technical indicators such as RSI, MACD, or Fibonacci retracements can provide more robust signals.
- Consider the Timeframe: Short-term traders might find shorter settings more useful, while longer-term traders might prefer longer settings. Experiment with different settings and backtest them to find what works best for your trading style.
- Use in Conjunction with Fundamental Analysis: Especially in the forex market, where macroeconomic events can significantly impact currency prices, it is essential to combine technical analysis with fundamental analysis.
- Practice Risk Management: Always have a risk management strategy in place. Determine your stop-loss and take-profit levels before entering a trade and be prepared for the possibility of losses.
Conclusion
The Ichimoku Cloud is a versatile and powerful tool in forex trading, providing traders with a comprehensive snapshot of market trends, momentum, and potential support and resistance levels. When used wisely and in combination with other technical and fundamental analysis tools, it can be a valuable addition to a forex trader’s arsenal. As always, practice and risk management are key to achieving consistent results in the unpredictable world of forex trading.