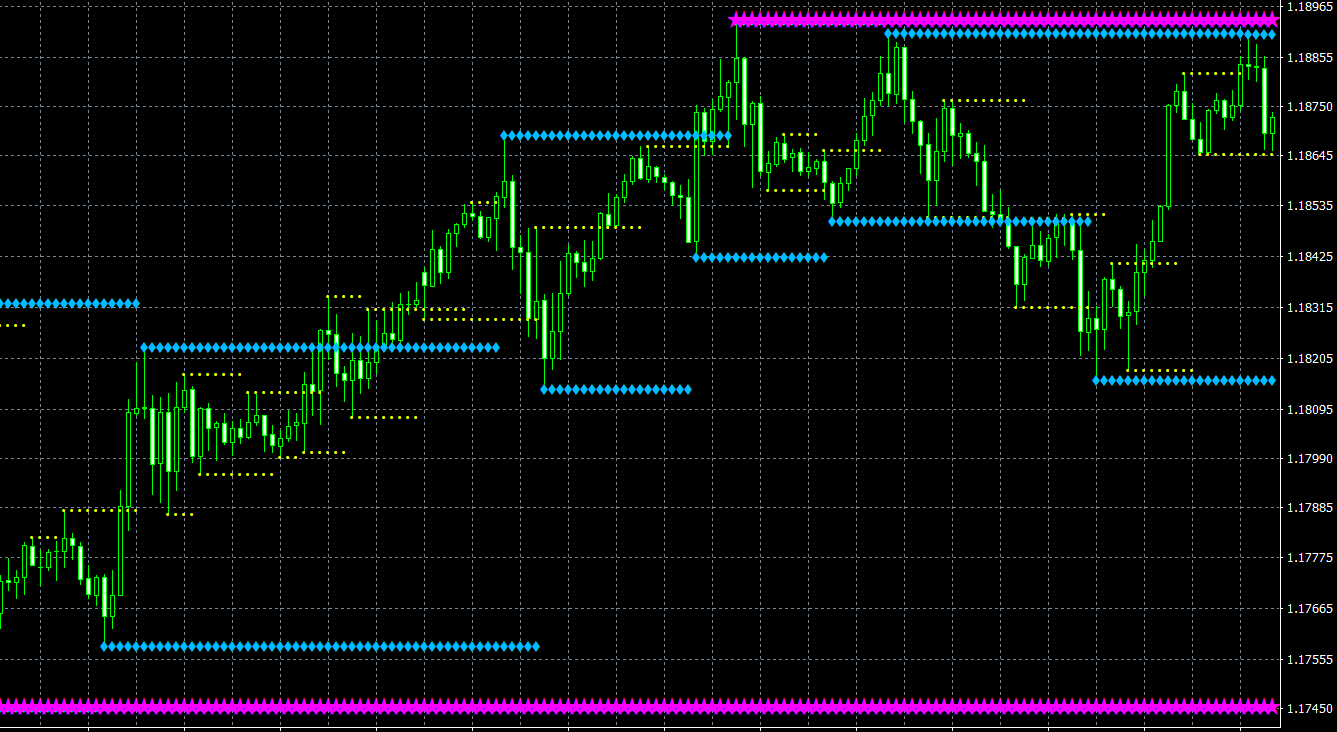
The KG Support and Resistance Forex indicator displays support and resistance levels on the price chart, calculated using classical symmetric fractals. The indicator uses four timeframes and two calculation methods.
What Is KG Support and Resistance MT4 Indicator
KG Support and Resistance MT4 indicator is a technical analysis tool that is used by traders to identify potential levels of support and resistance on a price chart. It is a widely popular indicator that is used by traders in various financial markets including Forex, stocks, and commodities. The indicator is easy to use and is available for free on many trading platforms including the MetaTrader 4 (MT4) platform.
The KG Support and Resistance MT4 indicator is based on the principle that price tends to find support at previous levels of resistance and resistance at previous levels of support. The indicator plots horizontal lines on the chart to indicate potential levels of support and resistance. These levels are identified based on the price action of the asset over a specific period of time.
The KG Support and Resistance MT4 indicator works by plotting support and resistance levels based on the price action of the currency. The indicator uses the high and low prices of the asset over a specific period of time to identify potential levels of support and resistance. The indicator then plots these levels on the chart as horizontal lines. The KG Support and Resistance level indicator displays levels from four timeframes that can be set in the settings.
The indicator uses two types of calculation (CalcPrices):
- at High / Low prices;
- at Open / Close prices.
And two types of drawing (DrawPrices):
- at High / Low prices;
- at Open / Close prices.
How to Use KG Support and Resistance Indicator in Forex Trading
When the price of the asset approaches one of these levels, traders may use it as a signal to enter or exit a trade. For example, if the price of an asset approaches a level of support, traders may interpret this as a buying opportunity. Conversely, if the price of an asset approaches a level of resistance, traders may interpret this as a selling opportunity.
Traders often use the KG Support and Resistance MT4 indicator in combination with other technical analysis tools such as trend lines, moving averages, and oscillators to identify potential trade setups. By combining multiple technical analysis tools, traders can increase their chances of success in the markets.
Conclusion
The KG Support and Resistance MT4 indicator is a popular technical analysis tool that is used by traders to identify potential levels of support and resistance on a price chart. The indicator is highly customizable and can be adjusted to suit individual trading needs. Traders often use the indicator in combination with other technical analysis tools to identify potential trade setups and increase their chances of success in the markets. The KG Support and Resistance level indicator is an effective tool for strategies focused on breakout and rebound from levels. Support and Resistance levels may also be your guide for placing take-profit or stop-loss orders.
Features of KG Support and Resistance MT4 indicator
- Platform: Metatrader 4
- Ability to change settings: Yes
- Timeframe: any from 1 Minute to Daily
- Currency pairs: any
In KG-Support-and-Resistance.zip file you will find:
- KG Support and Resistance.ex4
Download KG Support and Resistance MT4 indicator for free: