Trading is as much an art as it is a science, relying heavily on both technical analysis and trader intuition. In the arsenal of tools available to traders, technical indicators offer invaluable insights, guiding them towards more informed decision-making. Among the popular indicators on the MetaTrader 4 (MT4) platform, the TMA Centered Bands Indicator stands out as a versatile tool for both novice and expert traders. Let’s explore this indicator in depth, understanding its nuances and practical applications.
Introduction to TMA Centered Bands Indicator
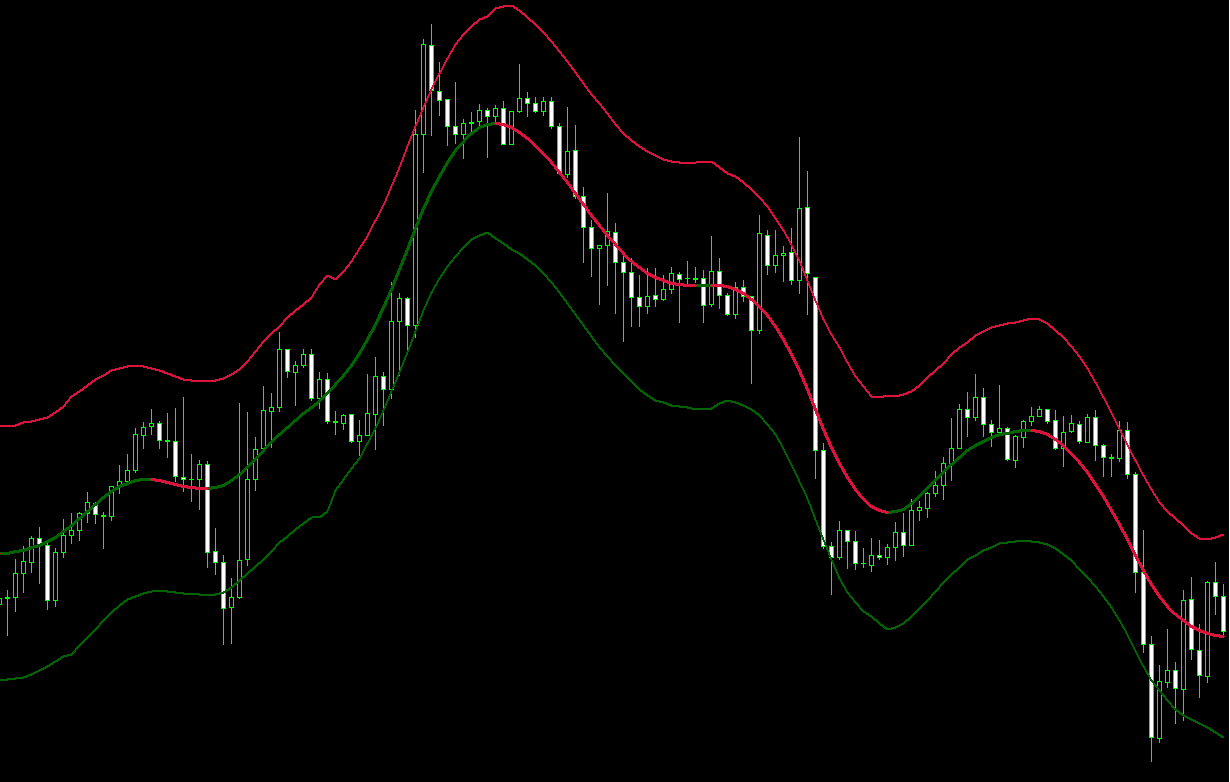
At its core, the TMA Centered Bands Indicator is a tool designed to provide insights into the overall price trend of a trading instrument. It achieves this by plotting three distinct bands on the trading chart.
Band Characteristics:
- Top Band: Colored in red, this band indicates potential resistance levels.
- Lower Band: Also colored red, this represents potential support levels.
- Middle Band: This is the dynamic band which changes its color based on the trend direction – turning green during uptrends and red during downtrends.
The foundation of this indicator lies in TMA (triangular moving averages), which is a smoothed average of a specific price over a predetermined number of periods.
Customizability
An interesting feature of the TMA Centered Bands Indicator is the flexibility it offers traders. You may change not only the period of TMA, price on which it is calculated, but also you can choose how the upper and lower bands are plotted, basing them either on:
- ATR (Average True Range): This is a measure of market volatility. Incorporating ATR into band calculation provides dynamic band widths based on recent price volatility.
- Standard Deviation: This gives a measure of price variability, hence the bands adjust based on how prices move relative to their average.
Trading Strategy Using TMA Centered Bands Indicator
For traders, understanding an indicator is just the beginning. The real challenge is translating that understanding into actionable trading strategies.
a. Ranging Markets: In a market that is moving sideways, the TMA Centered Bands can be especially useful.
- Short Positions: When the price breaches the upper band, it indicates potential overbuying, and thus, a reversal might be impending. Traders can consider entering short (sell) positions.
- Long Positions: Conversely, if the price dips below the lower band, it might be a signal of overselling, and a bounce back or upward reversal could be on the horizon. This can be an opportune moment to take long (buy) positions.
b. Trending Markets: While the TMA Centered Bands are invaluable in ranging markets, they also hold their own in trending scenarios.
- Direction Confirmation: The color of the middle band is crucial here. If it’s green, traders should primarily look for long opportunities (buying), and when it’s red, they should lean towards short opportunities (selling).
- Reversals: Even in trending markets, when the price goes beyond the bands, potential reversals might be around the corner. As always, traders should be cautious and use additional tools and analysis to confirm signals.
Conclusion
The TMA Centered Bands MT4 Indicator, with its dual emphasis on TMA and user-defined band calculation methods, offers traders a nuanced view of the market. Its adaptability to both ranging and trending markets makes it a versatile tool. However, as with all trading indicators, it is paramount that traders do not rely solely on it. It works best when used in conjunction with other tools, analysis methods, and sound risk management techniques. Always remember, in the realm of trading, informed decisions are the stepping stones to success.
Features of TMA Centered Bands MT4 indicator
- Platform: Metatrader 4
- Ability to change settings: Yes
- Timeframe: any from 1 Minute to Daily
- Currency pairs: any
In TMA_centered_bands.zip file you will find:
- TMA_centered_bands.ex4
Download TMA Centered Bands MT4 indicator for free:


