Foreign exchange (forex) trading can be an exciting and profitable venture for those willing to take the time to learn the ropes. A key skill that every successful forex trader must possess is the ability to read and interpret forex charts. This comprehensive guide will help you understand how to read forex charts and equip you with the tools you need to make informed trading decisions.
Understanding Forex Charts: The Basics
Forex charts are graphical representations of the movement of currency pairs over a specified period. They help traders visualize historical price action, identify trends, and make predictions about future price movements. There are three main types of forex charts: line charts, bar charts, and candlestick charts.
1. Line Charts
Line charts are the simplest type of forex charts. They plot the closing prices of a currency pair over a specified time frame, connecting these points with a line. Line charts provide a clear visual of the overall trend but lack detailed information about price movements within the selected time frame.
2. Bar Charts
Bar charts, also known as OHLC (open, high, low, close) charts, provide more detailed information than line charts. Each vertical bar represents a specific time period (e.g., 1 hour, 1 day, 1 week) and shows the open, high, low, and close prices for that period. The top of the bar indicates the highest price, the bottom of the bar represents the lowest price, and small horizontal lines on the left and right sides of the bar show the opening and closing prices, respectively.
3. Candlestick Charts
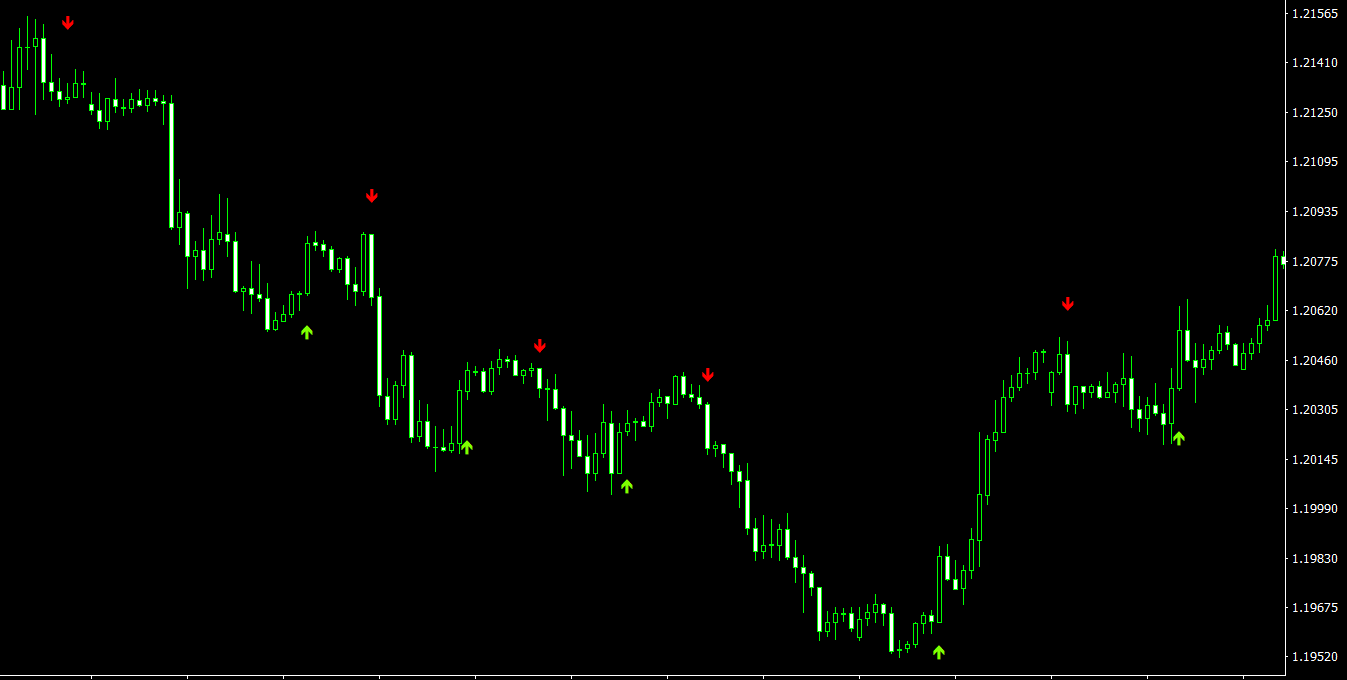
Candlestick charts are similar to bar charts in that they display open, high, low, and close prices for a specified time period. However, they use a more visual format, with “candlestick” shapes representing price movements. A candlestick has a rectangular “body” connecting the opening and closing prices and thin “wicks” extending from the top and bottom of the body to the high and low prices.
Candlesticks are color-coded to indicate whether the closing price was higher or lower than the opening price. A green (or white) candlestick indicates that the closing price was higher, while a red (or black) candlestick shows that the closing price was lower.
Time Frames
Forex charts can be displayed in various time frames, ranging from minutes to months. Short-term traders, such as day traders and scalpers, typically focus on shorter time frames (e.g., 1-minute, 5-minute, 15-minute charts), while long-term traders and investors might prefer daily, weekly, or monthly charts. Choosing the appropriate time frame depends on your trading style and strategy.
Forex Chart Indicators
Technical indicators are mathematical calculations based on price and volume data that help traders identify trends, reversals, and potential trading opportunities. Some common forex chart indicators include:
1. Moving Averages
A moving average (MA) is a widely-used technical indicator that smooths out price data to identify trends. There are several types of moving averages, such as simple moving average (SMA), exponential moving average (EMA), and weighted moving average (WMA).
2. Relative Strength Index (RSI)
The relative strength index (RSI) is a momentum oscillator that measures the speed and change of price movements. It ranges from 0 to 100 and helps traders identify overbought and oversold conditions.
3. Bollinger Bands
Bollinger Bands consist of a simple moving average (middle band) and two standard deviation lines (upper and lower bands) that adapt to changes in market volatility. They help traders identify potential price reversals and breakouts.
Support and Resistance Levels
Support and resistance levels are essential components of forex chart analysis. These levels represent price points where buying or selling pressure has historically halted a currency pair’s movement. Support levels act as a floor, preventing further downward movement, while resistance levels act as a ceiling, preventing further upward movement.
1. Identifying Support and Resistance
Traders can identify support and resistance levels by examining historical price action on a forex chart. Look for areas where the price has repeatedly reversed or consolidated before moving in the opposite direction. Support and resistance levels can also be identified using technical indicators such as pivot points, moving averages, and Fibonacci retracements.
2. Trading with Support and Resistance
Understanding support and resistance levels can help traders make informed decisions about when to enter or exit a trade. For example, a trader might choose to buy a currency pair when it approaches a strong support level, anticipating that the price will bounce off the level and continue upward. Conversely, a trader might sell a currency pair when it approaches a resistance level, expecting the price to reverse and decline.
Chart Patterns
Chart patterns are specific price formations that often lead to predictable price movements. By recognizing these patterns, traders can identify potential trading opportunities. Some common forex chart patterns include:
1. Head and Shoulders
The head and shoulders pattern is a reversal pattern that signals a potential trend change. It consists of three peaks – a higher peak (head) between two lower peaks (shoulders) – and a neckline that connects the two troughs between the peaks. A break below the neckline indicates a potential trend reversal from bullish to bearish.
2. Double Tops and Double Bottoms
Double tops and double bottoms are reversal patterns that occur when a currency pair’s price reaches the same level twice before reversing. A double top forms after an uptrend and signals a potential bearish reversal, while a double bottom forms after a downtrend and signals a potential bullish reversal.
3. Triangles
Triangles are continuation patterns that occur when a currency pair’s price consolidates within converging trendlines. There are three types of triangles: ascending, descending, and symmetrical. The breakout direction from the triangle pattern often indicates the continuation of the prevailing trend.
Conclusion
Learning how to read forex charts is a critical skill for any aspiring forex trader. By understanding different chart types, time frames, indicators, support and resistance levels, and chart patterns, you can better analyze market trends and make more informed trading decisions. Remember that practice makes perfect, so spend time reviewing forex charts and applying your knowledge to develop your skills and build confidence in your trading abilities.