Bands indicators are a family of technical analysis tools widely used by forex traders to assess market volatility and potential price movements. They consist of multiple lines or bands that envelop the price action and provide traders with visual cues about price dynamics, trends, and potential support and resistance levels. This article will delve into the concept of bands indicators, various types of bands indicators, and how to effectively use them in forex trading.
What are Bands Indicators?
Bands indicators are a group of technical analysis tools that comprise lines or bands plotted around the price action of a currency pair. These bands expand and contract based on the underlying asset’s volatility, providing traders with valuable information about market conditions and potential trading opportunities. The primary purpose of bands indicators is to identify overbought and oversold conditions, as well as to determine potential price breakouts or reversals.
Types of Bands Indicators
There are several types of bands indicators, each with its unique characteristics and applications. Some of the most popular bands indicators include:
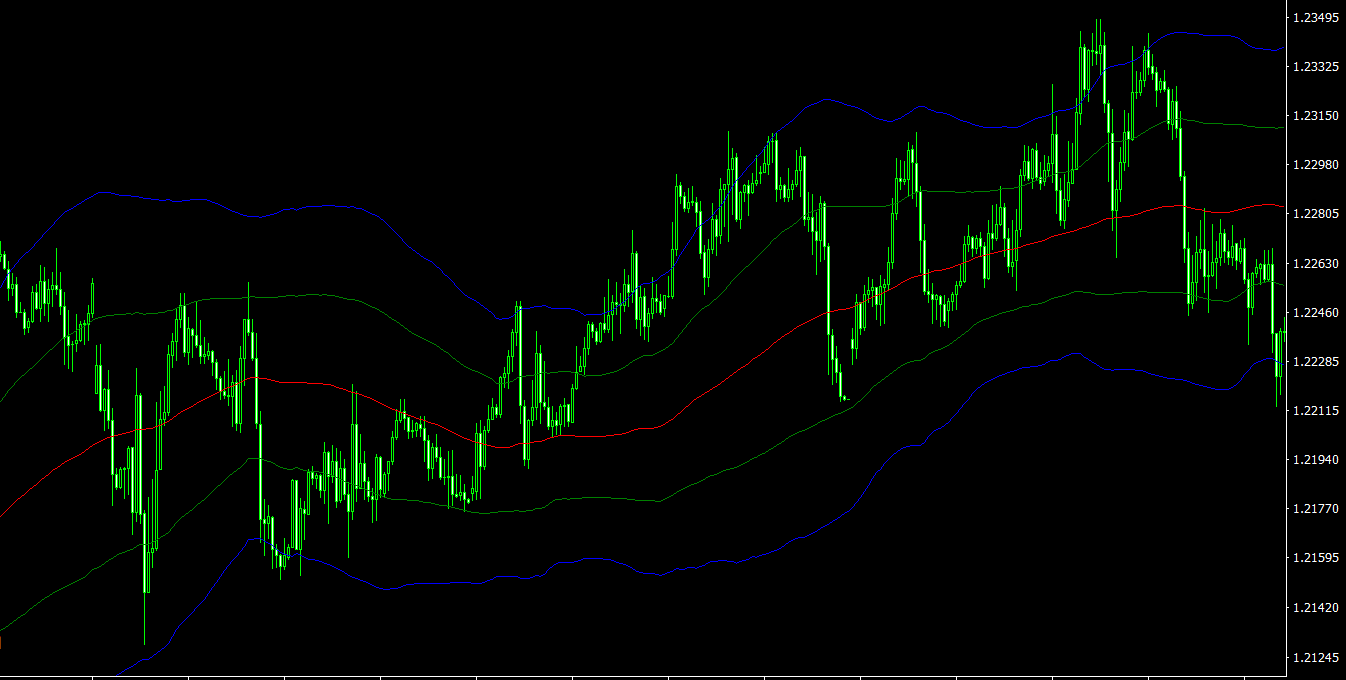
- Bollinger Bands: Developed by John Bollinger, Bollinger Bands are a set of volatility bands placed above and below a moving average, typically a 20-period simple moving average. The bands consist of an upper band, a lower band, and a middle band (the moving average). Bollinger Bands widen when volatility increases and contract when volatility decreases. Traders use Bollinger Bands to identify potential breakouts, reversals, and areas of support and resistance.
- Keltner Channels: Keltner Channels, created by Chester Keltner, consist of three bands: an upper band, a lower band, and a middle band (typically an exponential moving average). The upper and lower bands are calculated by adding and subtracting a multiple of the Average True Range (ATR) from the middle band. Keltner Channels are primarily used to identify trend direction, breakouts, and potential support and resistance levels.
- Donchian Channels: Named after Richard Donchian, Donchian Channels are calculated by plotting the highest high and the lowest low of a specified period (e.g., 20 periods), with the middle line representing the average of the two. Donchian Channels help traders identify trend direction, potential breakouts, and support and resistance levels.
- Envelopes: Envelopes are a set of two lines or bands plotted around a moving average at a fixed percentage above and below the moving average. Envelopes can be used to identify potential trend reversals and overbought or oversold conditions.
Using Bands Indicators in Forex Trading
To effectively use bands indicators in forex trading, consider the following tips:
- Select the appropriate bands indicator: Different bands indicators provide unique insights into market conditions and price action. Choose the bands indicator that best aligns with your trading strategy, objectives, and preferences.
- Combine bands indicators with other technical analysis tools: Bands indicators can provide valuable information about market conditions and potential trading opportunities. However, they should not be used in isolation. Combine bands indicators with other technical analysis tools, such as trend lines, support and resistance levels, and oscillators, to make more informed trading decisions.
- Adjust indicator settings to suit your trading style: Most bands indicators come with customizable settings that allow you to adjust their calculations to better align with your trading preferences and objectives. Experiment with different settings and timeframes to find the ones that work best for you.
- Backtest and refine your trading strategy: Before incorporating bands indicators into your live forex trading, test your trading strategy using historical data or a demo account. This process allows you to assess the effectiveness of the bands indicators and make any necessary adjustments to optimize your strategy’s performance.
- Manage your risk: Forex trading carries inherent risks, and employing sound risk management strategies is essential for long-term success. Use stop-loss orders, maintain appropriate position sizes, and diversify your investment portfolio to protect your capital and minimize potential losses.
Forex Trading Strategies Using Bands Indicators
Several forex trading strategies incorporate bands indicators to generate signals and identify trading opportunities. Some popular strategies include:
- Bollinger Bands Squeeze: The Bollinger Bands Squeeze strategy focuses on periods when the bands are narrow, indicating low volatility. When the bands begin to widen after a period of contraction, it may signal a potential breakout in the direction of the price movement. Traders can enter the market in the direction of the breakout, with a stop-loss order placed below the lower band for long positions or above the upper band for short positions.
- Keltner Channels Breakout: This strategy involves trading breakouts of the Keltner Channels. When the price moves above the upper band, it may signal a potential long position, with a stop-loss order placed below the lower band. Conversely, if the price moves below the lower band, it may suggest a potential short position, with a stop-loss order placed above the upper band.
- Donchian Channels Trend Following: The Donchian Channels Trend Following strategy involves entering the market when the price breaks above or below the Donchian Channels. If the price breaks above the upper band, traders can enter a long position, with a stop-loss order placed below the lower band. If the price breaks below the lower band, traders can enter a short position, with a stop-loss order placed above the upper band.
- Envelopes Reversal: The Envelopes Reversal strategy focuses on identifying potential reversals when the price touches or crosses the envelopes. When the price moves above the upper envelope, it may signal a potential short position, with a stop-loss order placed above the recent high. Conversely, if the price moves below the lower envelope, it may suggest a potential long position, with a stop-loss order placed below the recent low.
Conclusion
Bands indicators play a crucial role in helping forex traders analyze market conditions, assess volatility, and identify potential trading opportunities. Understanding the different types of bands indicators and how to effectively use them can significantly enhance your forex trading performance.
Incorporating bands indicators into your trading strategy can provide valuable insights into price action and market dynamics. By combining bands indicators with other technical analysis tools, adjusting their settings to suit your trading preferences, and implementing sound risk management strategies, you can increase your chances of success in the highly competitive forex market.