Binary options trading is a unique and popular financial instrument that offers traders the opportunity to make fixed returns based on the correct prediction of the direction of an underlying asset’s price. To make informed trading decisions, binary options traders rely on various technical analysis tools, including binary options indicators, to forecast price movements and identify trading opportunities. This article will explore the concept of binary options indicators, their different types, and how to effectively use them in binary options trading.
What are Binary Options Indicators?
Binary options indicators are a set of technical analysis tools specifically designed to help traders predict the future price direction of currency pairs, commodities, stocks, or indices within a predetermined timeframe. These indicators analyze historical price data and provide traders with information about market trends, volatility, momentum, and other factors that may influence the price of the underlying asset. By applying these indicators to their charts, traders can make more informed decisions about when to enter or exit binary options trades.
Types of Binary Options Indicators
There are several types of binary options indicators, each with its unique characteristics and applications. Some of the most popular binary options indicators include:
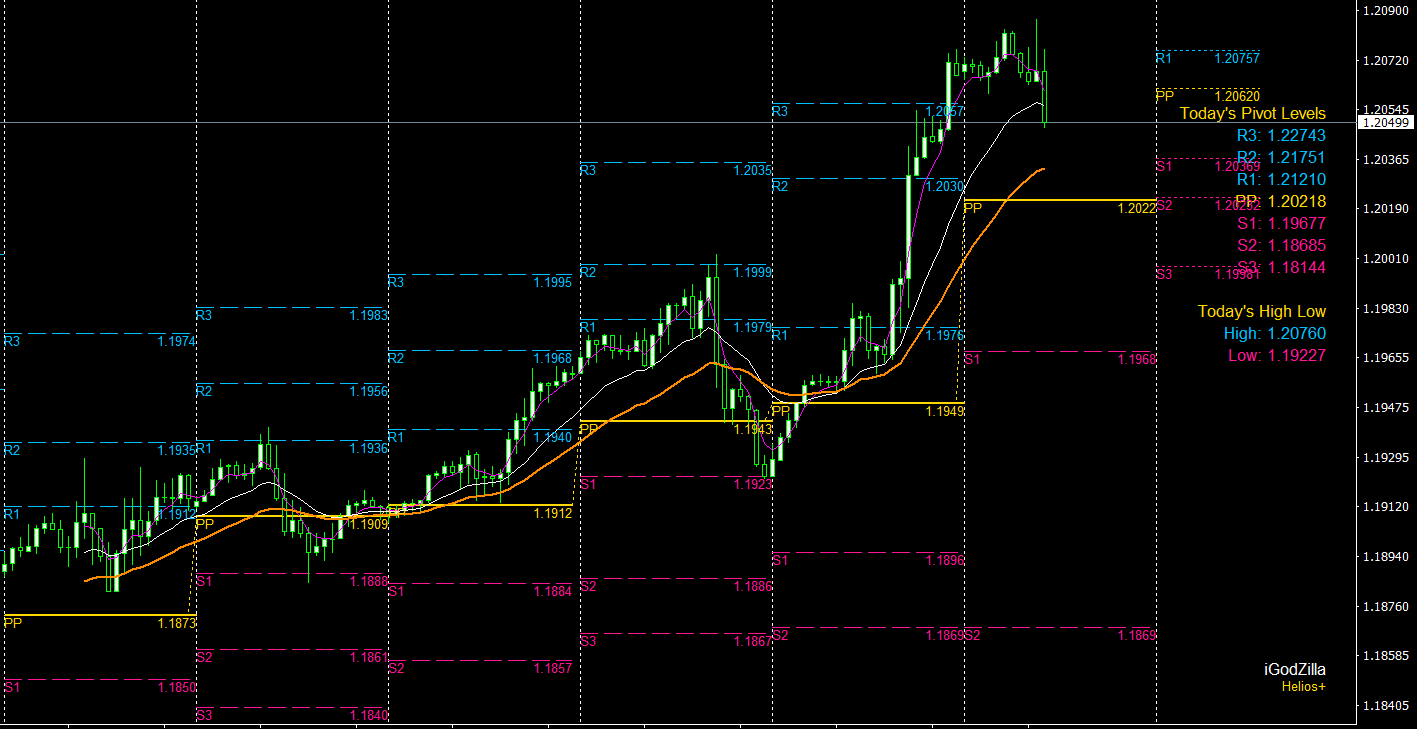
- Moving Averages: Moving averages are one of the most widely-used binary options indicators, providing traders with a smoothed representation of the underlying asset’s price trend. They can be calculated using different periods and types, such as simple, exponential, or weighted moving averages. Moving averages help traders identify trend direction and potential support and resistance levels.
- Relative Strength Index (RSI): The RSI is a momentum oscillator that measures the speed and change of price movements. The RSI ranges from 0 to 100, and traders typically use overbought and oversold levels to identify potential reversals in the market. The most commonly used levels are 30 (oversold) and 70 (overbought), which may signal potential buying or selling opportunities in binary options trading.
- Stochastic Oscillator: The Stochastic Oscillator is another momentum indicator that compares a security’s closing price to its price range over a specified period. It consists of two lines, %K and %D, which move between 0 and 100. Similar to the RSI, the Stochastic Oscillator identifies overbought and oversold conditions, providing potential trade entry or exit signals for binary options traders.
- Bollinger Bands: Bollinger Bands, developed by John Bollinger, are a set of volatility bands placed above and below a moving average. The bands widen and contract based on the asset’s price volatility. When the bands are wide, it indicates high volatility, while narrow bands suggest low volatility. Binary options traders can use Bollinger Bands to identify potential breakouts or reversals in the market.
- MACD (Moving Average Convergence Divergence): The MACD is a trend-following momentum indicator that calculates the difference between two moving averages, typically the 12-period and 26-period exponential moving averages. The MACD is represented as a histogram and a signal line, with the histogram providing information on the strength and direction of the trend, and the signal line acting as a trigger for buy and sell signals.
Using Binary Options Indicators in Trading
To effectively use binary options indicators, consider the following tips:
- Choose the right indicators for your trading strategy: Different binary options indicators serve various purposes, and it’s essential to select the ones that align with your trading strategy and objectives. For example, if your strategy focuses on trend-following, you might choose moving averages or the MACD, whereas if you prioritize volatility, Bollinger Bands may be more suitable.
- Combine multiple indicators for confirmation: Using multiple binary options indicators can provide a more comprehensive view of the market and help you make more informed trading decisions. By combining different types of indicators, such as trend-following, momentum, and volatility indicators, you can increase the accuracy of your predictions and reduce the risk of false signals.
- Optimize indicator settings: Most binary options indicators come with adjustable settings that allow you to customize their calculations and signals to suit your trading preferences. Experiment with different settings to find the ones that work best for your trading strategy and timeframe.
- Backtest and refine your trading strategy: Before applying binary options indicators to your live trading, it’s essential to backtest your trading strategy using historical data or a demo account. This process helps you assess the effectiveness of the chosen indicators and make any necessary adjustments to optimize your strategy’s performance.
- Manage your risk: Binary options trading can be highly profitable, but it also involves a degree of risk. Implement sound risk management strategies, such as using stop-loss orders, managing your position sizes, and diversifying your investment portfolio, to protect your capital and ensure long-term trading success.
Binary Options Trading Strategies Using Indicators
Several binary options trading strategies rely on indicators to generate signals and identify trading opportunities. Some popular strategies include:
- Moving Average Crossover Strategy: This strategy involves using two different moving averages, typically a shorter and a longer period, to generate trade signals. When the shorter moving average crosses above the longer moving average, it may signal a potential “call” option, whereas a cross below the longer moving average suggests a potential “put” option.
- RSI and Stochastic Oscillator Divergence Strategy: This strategy involves identifying divergences between the price of the underlying asset and the RSI or Stochastic Oscillator. When the price forms higher highs, but the RSI or Stochastic Oscillator forms lower highs, it may signal a potential reversal to the downside, warranting a “put” option. Conversely, if the price forms lower lows while the indicator forms higher lows, it may suggest a potential reversal to the upside, indicating a “call” option.
- Bollinger Band Squeeze Strategy: This strategy capitalizes on periods of low volatility identified by the Bollinger Bands. When the bands contract and the price breaks above or below the bands, it may signal a potential breakout, providing a “call” or “put” option opportunity based on the breakout direction.
- MACD Crossover Strategy: This strategy involves using the MACD histogram and signal line to generate trade signals. When the MACD histogram crosses above the signal line, it may indicate a potential “call” option, whereas a cross below the signal line suggests a potential “put” option.
Conclusion
In conclusion, binary options indicators play a crucial role in helping traders make informed decisions about their trades. By understanding the various types of binary options indicators and how to use them effectively, traders can maximize their potential for success in the binary options market.
Incorporating binary options indicators into your trading strategy can provide valuable insights into price movements and market dynamics. By combining multiple indicators, optimizing their settings, and implementing sound risk management strategies, you can increase your chances of success in the highly competitive and ever-changing binary options market.


