The Relative Strength Index (RSI) is a widely used technical analysis tool among forex traders, designed to measure the strength of price movements and identify potential trend reversals. As a momentum oscillator, the RSI provides valuable insights into market conditions, helping traders make informed decisions and optimize their trading strategies. This article will discuss what RSI indicators are, their importance in forex trading, and how traders can effectively use them to enhance their trading strategies.
What is the RSI Indicator?
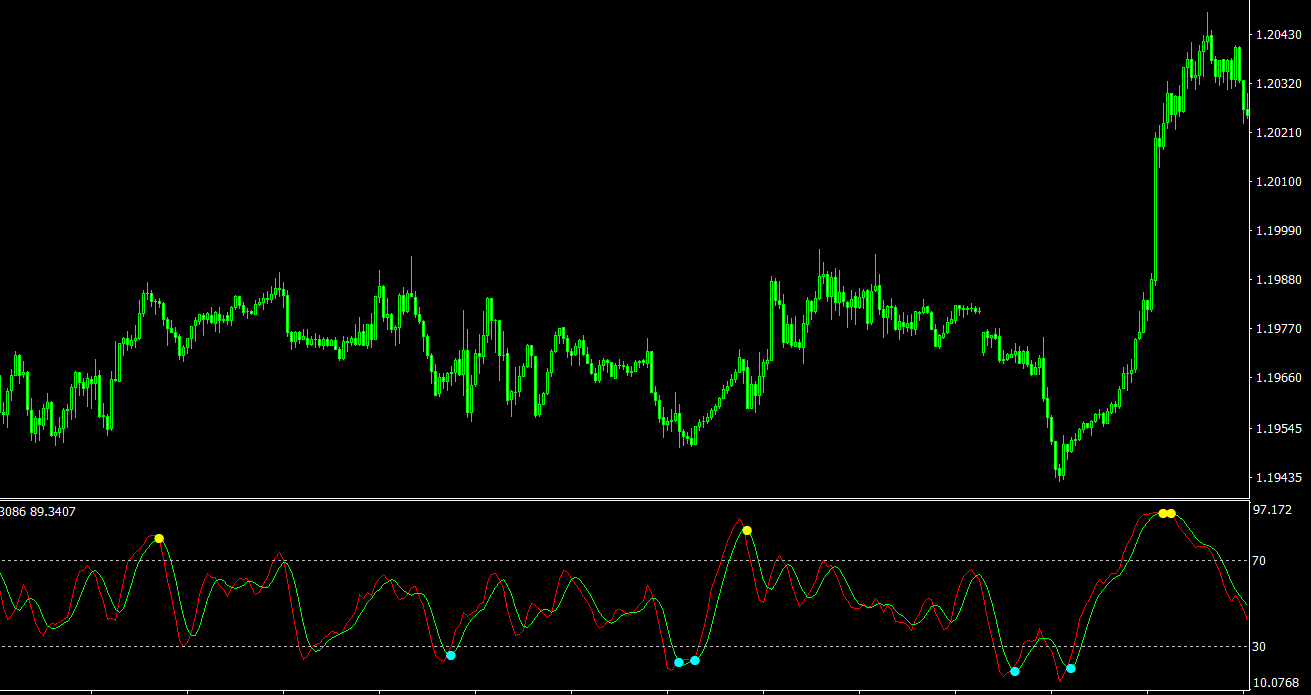
Developed by J. Welles Wilder in 1978, the Relative Strength Index (RSI) is a momentum oscillator that measures the speed and change of price movements. The RSI is calculated by comparing the average gain of up periods to the average loss of down periods over a specific time frame, typically 14 periods. The RSI ranges from 0 to 100, with values above 70 generally considered overbought and values below 30 considered oversold.
The Importance of RSI Indicators in Forex Trading
The RSI indicator plays a crucial role in forex trading, offering valuable insights into market dynamics and potential trading opportunities. Some of the benefits of using the RSI indicator include:
- Identifying Overbought and Oversold Conditions: The RSI can help traders identify potential trend reversals by signaling when a currency pair is overbought or oversold.
- Confirming Trend Direction: The RSI can provide confirmation of the direction of a trend, helping traders make more informed trading decisions.
- Enhancing Trading Strategies: Incorporating the RSI into a trading strategy can improve its effectiveness, allowing traders to better identify potential trading opportunities and manage risk.
- Divergence Detection: The RSI can help traders identify divergence between price action and the oscillator, which can signal potential trend reversals.
How to Use RSI Indicators in Forex Trading
Effectively utilizing RSI indicators in forex trading can help traders identify potential entry and exit points, as well as assess market conditions and manage risk. Here are some tips for using RSI indicators in your trading strategy:
- Monitor Overbought and Oversold Levels: Keep an eye on the RSI values, looking for levels above 70 (overbought) or below 30 (oversold). These levels can signal potential trend reversals, providing opportunities to enter or exit trades.
- Observe Divergence: Look for instances where the RSI diverges from the price action. If the price is making higher highs, but the RSI is making lower highs, this could indicate a potential bearish reversal. Conversely, if the price is making lower lows, but the RSI is making higher lows, this could signal a potential bullish reversal.
- Use RSI in Conjunction with Other Indicators: Combine the RSI with other technical analysis tools, such as moving averages, trend lines, and chart patterns, to create a well-rounded trading strategy.
- Customize RSI Settings: Adjust the RSI settings, such as the time period, to better align with your trading style and the specific currency pairs you are trading.
- Employ Risk Management Techniques: Utilize risk management strategies, such as setting stop loss orders and using appropriate position sizing, to protect your capital and minimize potential losses.
Using RSI Indicators in Forex Trading
When using RSI indicators in forex trading, it’s essential to incorporate them into a comprehensive trading strategy that includes risk management techniques and other technical analysis tools. Here are some steps to effectively utilize RSI indicators in your trading approach:
- Analyze the Currency Pair: Begin by analyzing the currency pair you are interested in trading, taking note of any prevailing trends, support and resistance levels, and chart patterns.
- Apply the RSI Indicator: Add the RSI indicator to your price chart, adjusting the settings as necessary to suit your trading style and the specific currency pair.
- Monitor RSI Levels: Regularly check the RSI values, paying close attention to overbought and oversold levels, as well as any divergence between the RSI and price action.
- Identify Potential Entry and Exit Points: Use the RSI indicator in conjunction with other technical analysis tools to identify potential entry and exit points for your trades. For example, you might enter a long position when the RSI crosses above the 30 level (oversold) and exits when the RSI crosses below the 70 level (overbought).
- Set Stop Loss and Take Profit Orders: Use the RSI indicator, along with support and resistance levels and other technical tools, to determine appropriate stop loss and take profit levels for your trades.
- Manage Risk: Ensure that you employ proper risk management techniques, such as setting stop loss orders, using appropriate position sizing, and maintaining a balanced portfolio.
- Continuously Evaluate and Adjust Your Strategy: Regularly review your trading performance and make any necessary adjustments to your RSI-based trading strategy based on your results and changing market conditions.
Conclusion
The RSI indicator is a powerful tool in forex trading, providing valuable insights into market dynamics and potential trading opportunities. By understanding and effectively utilizing RSI indicators, traders can make more informed decisions, optimize their trading strategies, and better manage risk. Combining RSI indicators with other technical analysis tools can further enhance a trader’s ability to navigate the complexities of the forex market, ultimately contributing to improved trading performance and profitability. As with any trading tool, practice and ongoing education are key to mastering the use of RSI indicators and reaping the benefits they offer in forex trading.