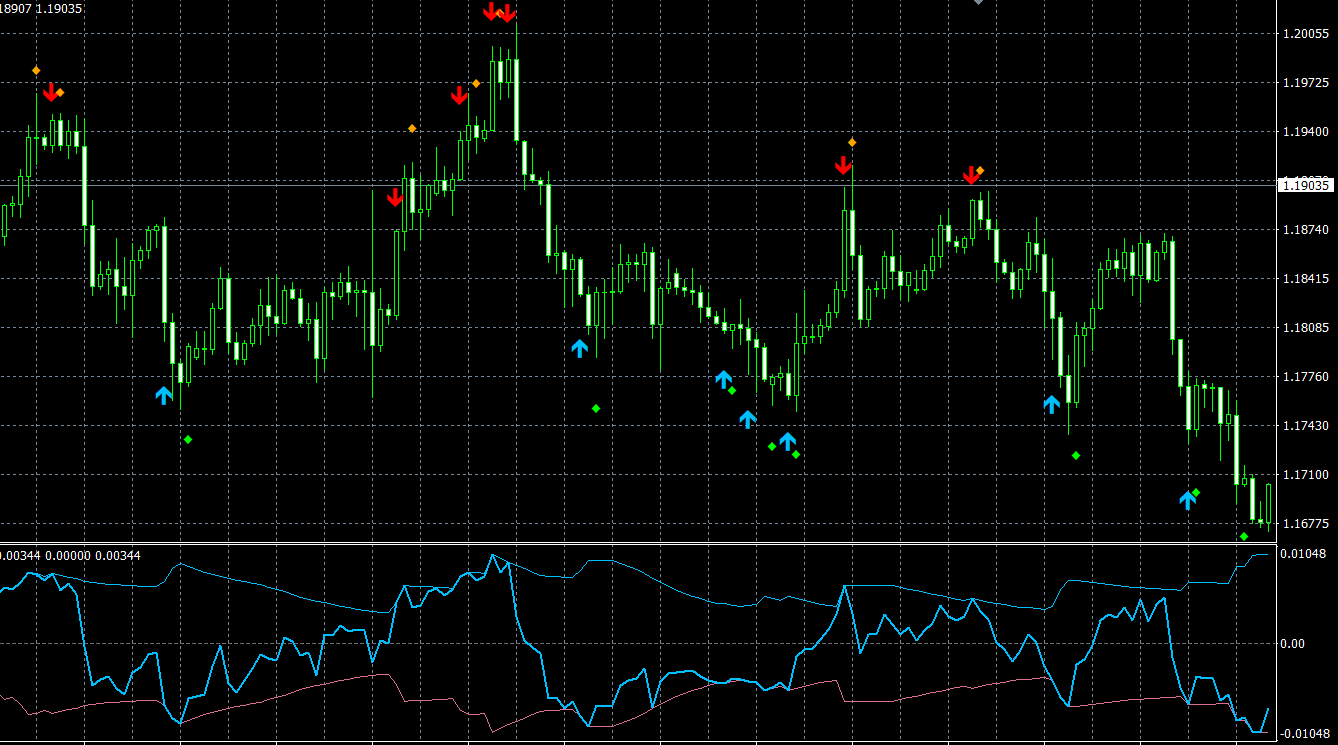
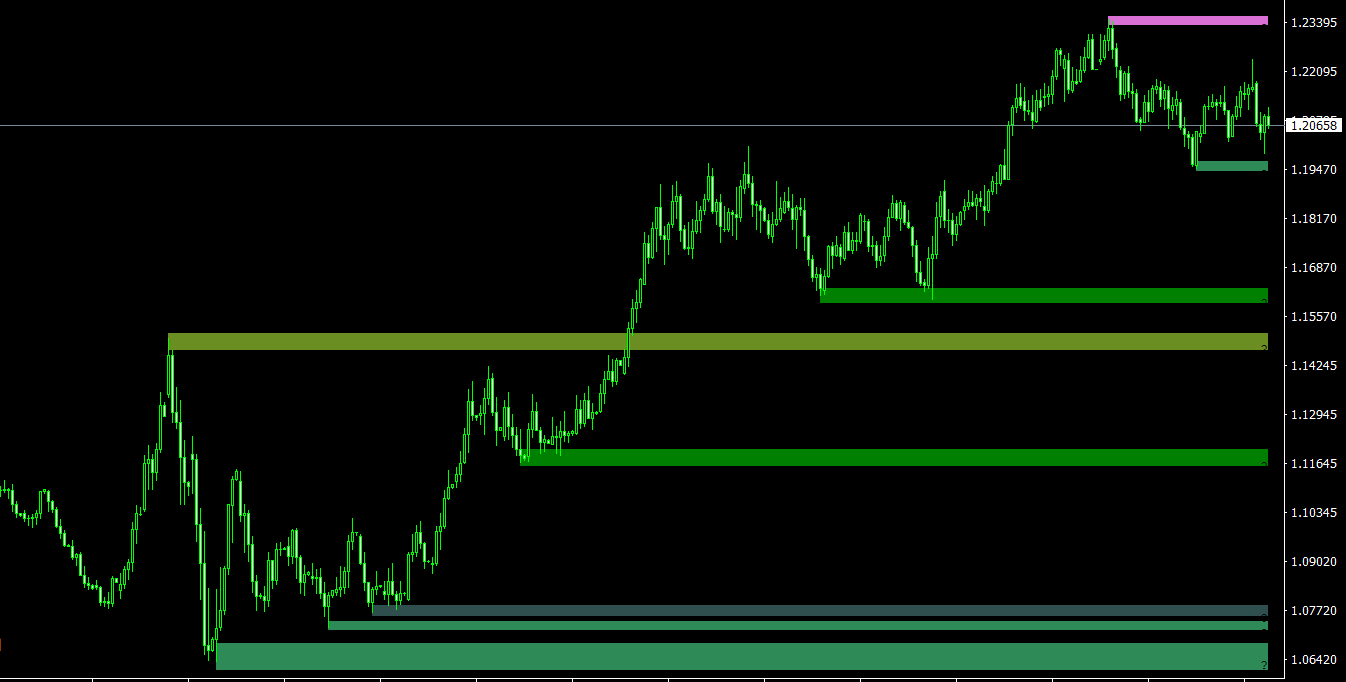
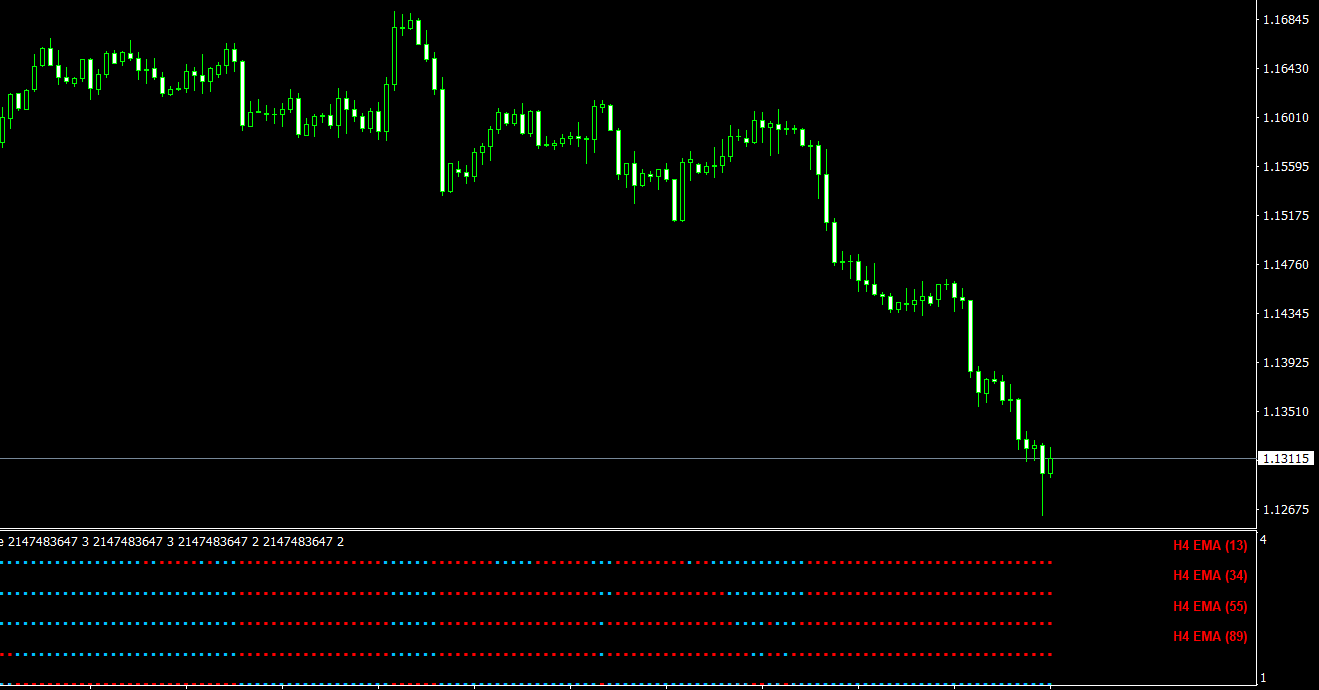
In forex trading, technical analysis is a widely used method for predicting price movements and making informed trading decisions. One critical aspect of technical analysis is the use of indicators, which provide valuable information about market trends, momentum, and volatility. Non-repainting indicators have become increasingly popular among forex traders due to their reliability and ability to provide real-time insights. This article will discuss the concept of non-repainting indicators, their advantages, and how to effectively use them in forex trading.
What are Non-Repainting Indicators?
In the realm of forex trading, indicators can be classified into two main categories: repainting and non-repainting. Repainting indicators are those that change their values and signals after a new price bar has closed, essentially “repainting” their historical values. This can create misleading signals and make it challenging to identify genuine market trends.
On the other hand, non-repainting indicators are those that do not change their values or signals once a price bar has closed. These indicators provide real-time data and maintain their historical values, making it easier for traders to analyze past market conditions and make more accurate trading decisions. Non-repainting indicators are often considered more reliable and useful than their repainting counterparts, as they offer a clearer and more consistent picture of the market.
Examples of Non-Repainting Indicators
There are several non-repainting indicators used by forex traders, each with its unique features and advantages. Some of the most popular non-repainting indicators include:
- Moving Averages (Simple, Exponential, Weighted)
- Bollinger Bands
- Parabolic SAR
- Average True Range (ATR)
- On Balance Volume (OBV)
- Standard Deviation
- Moving Averages
Moving Averages are one of the most commonly used non-repainting indicators in forex trading. They calculate the average price of a currency pair over a specific period, smoothing out price fluctuations and providing a clearer view of the overall market trend. There are three main types of moving averages: Simple Moving Average (SMA), Exponential Moving Average (EMA), and Weighted Moving Average (WMA).
Simple Moving Average (SMA) calculates the average price over a specified period, giving equal weight to all price data points. Exponential Moving Average (EMA) assigns more weight to recent price data, making it more responsive to current market conditions. Weighted Moving Average (WMA) also assigns more weight to recent price data but uses a different weighting method than the EMA.
- Bollinger Bands
Bollinger Bands, developed by John Bollinger, are a set of non-repainting indicators that measure market volatility. They consist of three lines: a central moving average (usually a 20-period SMA) and two outer bands that are two standard deviations away from the central moving average. When the bands contract, it indicates low market volatility, while expanding bands signify high market volatility.
- Parabolic SAR
The Parabolic Stop and Reverse (SAR) is a non-repainting indicator developed by J. Welles Wilder Jr. that identifies potential trend reversals and provides entry and exit points for traders. The Parabolic SAR plots a series of dots either above or below the price, depending on the prevailing trend. When the dots are below the price, it indicates a bullish trend, and when they are above the price, it signifies a bearish trend.
- Average True Range (ATR)
The Average True Range (ATR), another creation of J. Welles Wilder Jr., is a non-repainting indicator that measures market volatility by calculating the average range between the high and low prices over a specified period. A higher ATR value indicates higher market volatility, while a lower ATR value suggests lower volatility. The ATR can be used to set stop-loss levels, take profit targets, and assess the riskiness of a particular trade.
- On Balance Volume (OBV)
The On Balance Volume (OBV) is a non-repainting indicator developed by Joe Granville that measures the flow of volume in and out of a currency pair. The OBV adds volume to a running total when the price closes higher than the previous close and subtracts volume when the price closes lower than the previous close. This indicator can help traders identify potential breakouts, as an increase in the OBV may signal strong buying pressure, while a decrease in the OBV may indicate strong selling pressure.
- Standard Deviation
Standard Deviation is a non-repainting indicator that measures the dispersion of price data around the mean (average). A higher standard deviation indicates greater price volatility, while a lower standard deviation suggests lower volatility. This indicator can be used in conjunction with other technical analysis tools, such as Bollinger Bands or moving averages, to identify potential trading opportunities.
Using Non-Repainting Indicators in Forex Trading
Non-repainting indicators can be valuable tools for forex traders seeking to make informed decisions and develop robust trading strategies. To effectively use non-repainting indicators in forex trading, consider the following steps:
- Choose the appropriate non-repainting indicator(s): Select the indicator(s) that best align with your trading strategy and the market conditions. It’s crucial to understand the strengths and limitations of each indicator to maximize their effectiveness.
- Combine non-repainting indicators with other technical analysis tools: While non-repainting indicators can be powerful on their own, combining them with other technical analysis tools, such as chart patterns, trend lines, and support and resistance levels, can provide additional confirmation and enhance their effectiveness.
- Analyze multiple timeframes: Examining currency pairs on multiple timeframes can provide a more comprehensive view of the market and help you identify potential trading opportunities more effectively. For example, you may use a longer timeframe to assess the overall trend and a shorter timeframe to pinpoint entry and exit points.
- Implement sound risk management strategies: Despite the increased reliability of non-repainting indicators, forex trading always involves a degree of uncertainty. It’s essential to practice sound risk management strategies, such as setting stop-loss orders, managing your position sizes, and maintaining a diversified portfolio to protect your capital and ensure long-term trading success.
- Continuously evaluate and adjust your trading strategy: The forex market is dynamic and constantly evolving. Regularly assess the effectiveness of your trading strategy and the performance of your chosen non-repainting indicators, making adjustments as necessary to stay ahead of the curve and adapt to changing market conditions.
Conclusion
Non-repainting indicators are valuable tools for forex traders looking to make more accurate trading decisions and develop successful strategies. By understanding the various non-repainting indicators and how to effectively use them in conjunction with other technical analysis tools, traders can maximize their potential for success in the forex market.


