Foreign exchange, or forex, trading has become increasingly popular in recent years as investors look for new ways to diversify their portfolios and take advantage of global financial markets. One of the key aspects of successful forex trading is the use of technical analysis. Technical analysis is a widely utilized methodology for forecasting price movements based on historical market data. It involves the study of price charts and various indicators to identify patterns that can predict future price trends.
In this article, we will explore the concept of technical analysis in forex trading, its underlying principles, the various types of tools and indicators used, and how to apply it effectively in your trading strategy.
The Foundations of Technical Analysis
Technical analysis is based on three key assumptions:
a) Market action discounts everything: This assumption suggests that all relevant information that can affect the price of a currency pair is already reflected in the market price. Therefore, technical analysts focus solely on price movements and disregard fundamental factors such as economic data, news events, or geopolitical developments.
b) Prices move in trends: Technical analysts believe that prices tend to move in identifiable trends, either upward, downward, or sideways. By analyzing historical price data, they aim to identify these trends and predict their future direction.
c) History tends to repeat itself: This principle suggests that specific patterns in price movements tend to recur over time, as traders and investors exhibit similar psychological reactions to market events. Technical analysts use these recurring patterns as the basis for their forecasts.
Types of Charts in Technical Analysis
Technical analysts use various types of charts to study historical price data. The most common types are:
a) Line charts: These charts display the closing price of a currency pair for each period (e.g., daily, hourly, or minutely) connected by a line. Line charts are simple and provide a clear overview of the general price movement over time.
b) Bar charts: Bar charts represent the opening, high, low, and closing (OHLC) prices for each period with vertical bars. The top of the bar indicates the highest price, the bottom of the bar indicates the lowest price, and small horizontal lines on the left and right represent the opening and closing prices, respectively.
c) Candlestick charts: Similar to bar charts, candlestick charts also show the OHLC prices for each period. However, they use a different visual representation, with a “candle body” indicating the difference between the opening and closing prices and “wicks” extending from the top and bottom of the body to represent the high and low prices. Candlestick charts are popular among forex traders due to their easy-to-read visual patterns that can provide valuable insights into market psychology.
Technical Analysis Tools and Indicators
There are various tools and indicators that technical analysts use to analyze price charts and identify patterns. Some of the most common include:
a) Trendlines: Trendlines are straight lines drawn on a chart to connect significant price points, such as highs or lows, and help identify the direction of the trend. They can act as support and resistance levels, where buying or selling pressure may increase or decrease, respectively.
b) Moving averages: Moving averages are calculated by taking the average closing price of a currency pair over a specified number of periods. They are used to smooth out price fluctuations and identify trends more easily. There are different types of moving averages, such as simple, exponential, and weighted, each with its own advantages and drawbacks.
c) Oscillators: Oscillators are indicators that move within a defined range (usually between 0 and 100) and are used to identify overbought or oversold conditions in the market. Common oscillators include the Relative Strength Index (RSI), Stochastic Oscillator, and the Commodity Channel Index (CCI). When the oscillator reaches extreme levels, it may signal a potential reversal in price direction.
d) Chart patterns: Chart patterns are specific formations in price charts that technical analysts use to predict future price movements. These patterns can be classified into continuation patterns, such as triangles, flags, and pennants, which indicate that the current trend is likely to continue, and reversal patterns, such as head and shoulders, double tops and bottoms, and cup and handle formations, which suggest that the current trend may be about to reverse.
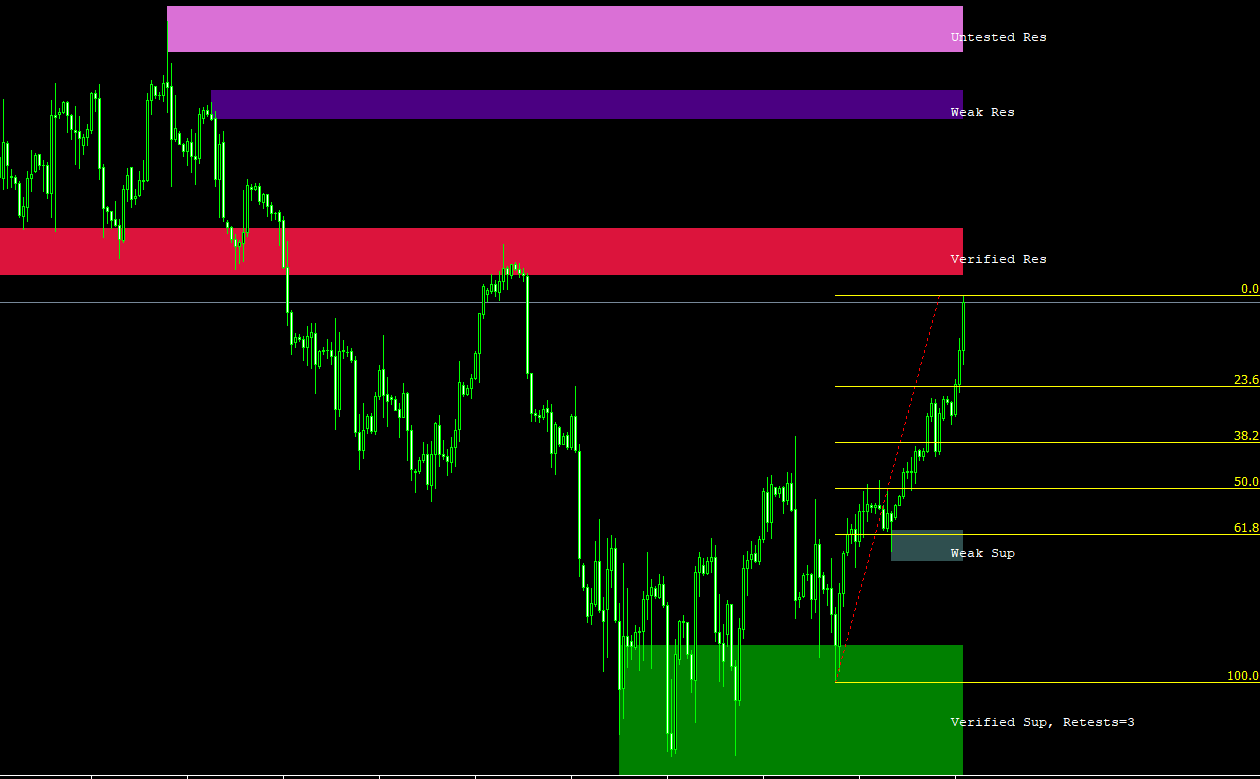
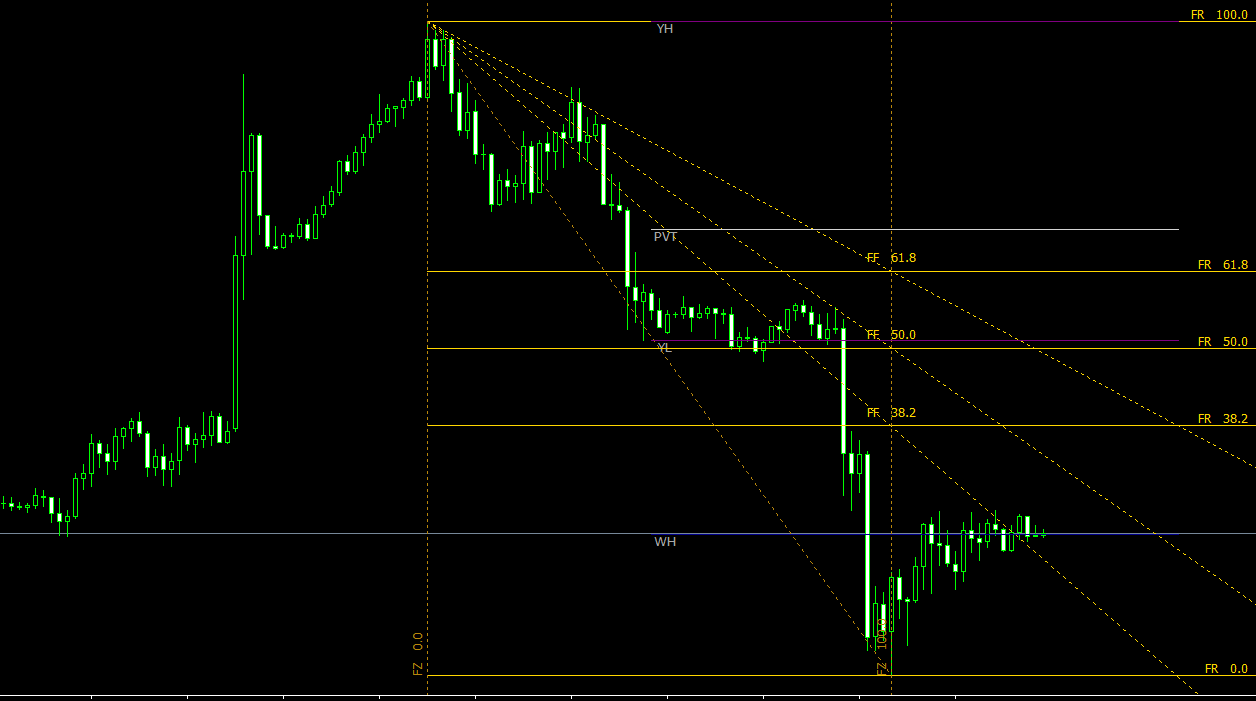
e) Fibonacci retracements and extensions: Fibonacci retracements and extensions are mathematical tools used to identify potential support and resistance levels based on the ratios found in the Fibonacci sequence (0, 1, 1, 2, 3, 5, 8, 13, 21, and so on). These ratios (23.6%, 38.2%, 50%, 61.8%, and 100%) are applied to price charts to predict where the price may retrace or extend before resuming the prevailing trend.
How to Use Technical Analysis in Forex Trading
To effectively use technical analysis in forex trading, follow these steps:
a) Choose the appropriate time frame: Depending on your trading style and objectives, select a suitable time frame for your analysis. Short-term traders, such as scalpers and day traders, may focus on minute or hourly charts, while swing traders and long-term investors may prefer daily, weekly, or even monthly charts.
b) Identify the trend: Analyze the price chart and use tools such as trendlines and moving averages to determine the direction of the market trend. Trade in the direction of the prevailing trend to increase your chances of success.
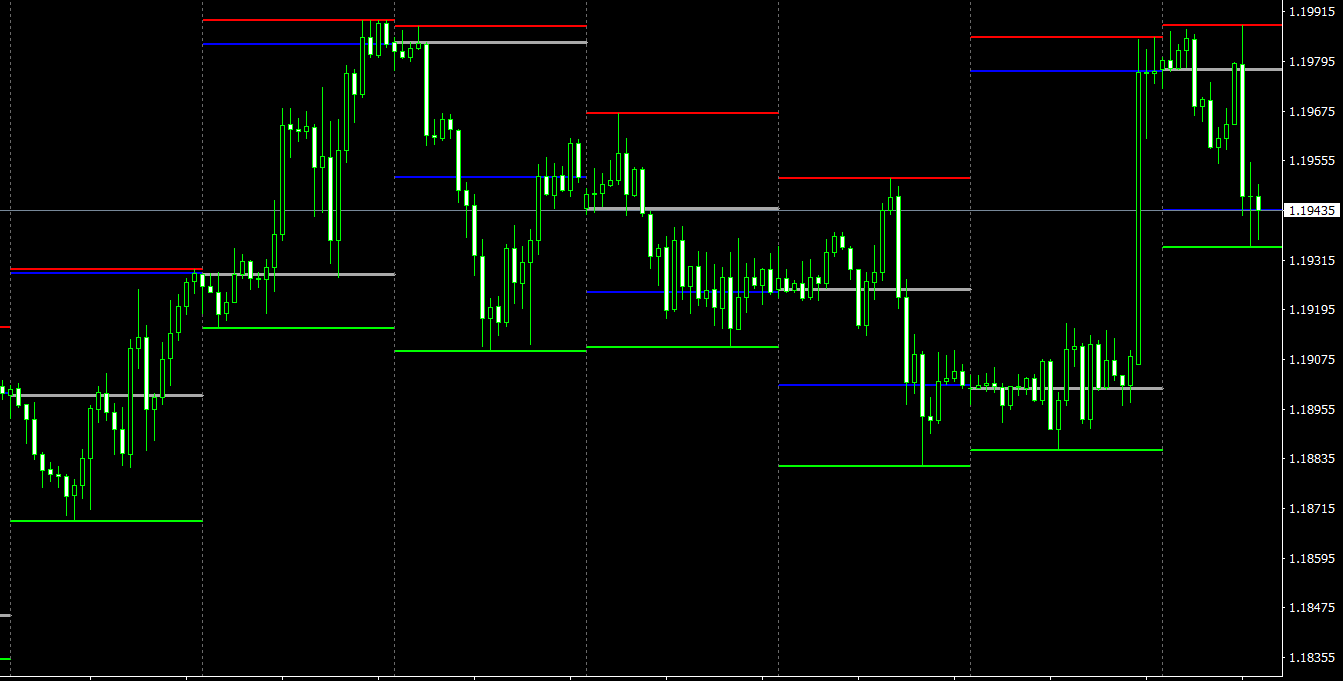
c) Recognize support and resistance levels: Use tools like horizontal lines, trendlines, Fibonacci retracements, and pivot points to identify potential support and resistance levels. These levels can be crucial for determining entry and exit points, as well as setting stop-loss and take-profit orders.
d) Apply multiple indicators: Combine different indicators to confirm signals and improve the accuracy of your analysis. For example, you might use an oscillator like the RSI to identify overbought or oversold conditions and then confirm the signal with a chart pattern or trendline breakout.
e) Develop a trading strategy: Create a set of rules for your trades based on your technical analysis, including entry and exit points, stop-loss and take-profit levels, and risk management guidelines. Stick to your strategy and avoid making impulsive decisions based on emotions.
f) Test your strategy: Before implementing your technical analysis-based trading strategy on a live account, test it on historical data or use a demo account to see how it performs under various market conditions. This can help you identify potential weaknesses and optimize your strategy.
g) Review and adjust: Regularly review your trading performance and the effectiveness of your technical analysis techniques. Learn from your mistakes and make necessary adjustments to improve your trading results.
Conclusion
Technical analysis is a valuable tool for forex traders, providing insights into market trends and potential price movements based on historical data. By understanding the principles of technical analysis, using various tools and indicators, and applying them effectively in a well-developed trading strategy, you can improve your chances of success in the forex market. Remember, however, that no analysis method is foolproof, and it’s essential to use risk management techniques and maintain discipline to protect your trading capital.


